Graphing Exponential Functions
Interactive Video
•
Mathematics
•
6th - 8th Grade
•
Practice Problem
•
Hard
+2
Standards-aligned

Amelia Wright
Used 1+ times
FREE Resource
Standards-aligned
Read more
10 questions
Show all answers
1.
MULTIPLE CHOICE QUESTION
30 sec • 1 pt
What is the result of 2 to the power of -2?
1/4
1/2
4
2
Tags
CCSS.8.EE.A.1
2.
MULTIPLE CHOICE QUESTION
30 sec • 1 pt
What is the y-value when x is 0 for the function 3 * 2^x?
6
12
3
1
Tags
CCSS.HSF.LE.B.5
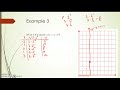
3.
MULTIPLE CHOICE QUESTION
30 sec • 1 pt
How many points are typically used by the teacher for hand graphing non-linear functions?
Two
Three
Five
Ten
Tags
CCSS.HSF-IF.C.7A
4.
MULTIPLE CHOICE QUESTION
30 sec • 1 pt
Why is it important to use more than two points for graphing non-linear functions?
To make it easier
To use less paper
To understand the shape
To save time
5.
MULTIPLE CHOICE QUESTION
30 sec • 1 pt
What is the significance of the y-axis in graphing?
Represents value
Represents cost
Represents quantity
Represents time
6.
MULTIPLE CHOICE QUESTION
30 sec • 1 pt
What does the function f(x) = 100 * 0.25^x model in the context of computer mapping software?
Data usage
Zoom level percentage
Screen resolution
Number of users
Tags
CCSS.HSF.LE.B.5
7.
MULTIPLE CHOICE QUESTION
30 sec • 1 pt
What is the y-value when x is 1 for the function 100 * 0.25^x?
100
50
12.5
25
Tags
CCSS.HSF-IF.C.8B
Access all questions and much more by creating a free account
Create resources
Host any resource
Get auto-graded reports
Continue with Google

Continue with Email
Continue with Classlink
Continue with Clever
or continue with
Microsoft
%20(1).png)
Apple
Others
Already have an account?
Similar Resources on Wayground
Popular Resources on Wayground

15 questions
Fractions on a Number Line
Quiz
•
3rd Grade
20 questions
Equivalent Fractions
Quiz
•
3rd Grade
25 questions
Multiplication Facts
Quiz
•
5th Grade
54 questions
Analyzing Line Graphs & Tables
Quiz
•
4th Grade
22 questions
fractions
Quiz
•
3rd Grade
20 questions
Main Idea and Details
Quiz
•
5th Grade
20 questions
Context Clues
Quiz
•
6th Grade
15 questions
Equivalent Fractions
Quiz
•
4th Grade
Discover more resources for Mathematics
22 questions
distributive property
Quiz
•
7th Grade
18 questions
Angle Relationships
Quiz
•
7th Grade
15 questions
Distributive Property & Review
Quiz
•
6th Grade
20 questions
Writing Algebraic Expressions
Quiz
•
6th Grade
20 questions
How Some Friendships Last — and Others Don’t Video Questions
Quiz
•
7th Grade
14 questions
finding slope from a graph
Quiz
•
8th Grade
20 questions
Ratios/Rates and Unit Rates
Quiz
•
6th Grade
18 questions
Handbook Refresher Quiz
Quiz
•
7th Grade