- Resource Library
- Math
- Probability And Statistics
- Box And Whisker Plot
- Exploring Box And Whisker Plots And Two Way Frequency Tables
Exploring Box-and-Whisker Plots and Two-Way Frequency Tables
Interactive Video
•
Mathematics
•
9th - 12th Grade
•
Practice Problem
•
Hard
+1
Standards-aligned

Emma Peterson
Used 1+ times
FREE Resource
Standards-aligned
10 questions
Show all answers
1.
MULTIPLE CHOICE QUESTION
30 sec • 1 pt
What does each quartile in a box and whisker plot represent?
50% of the data
100% of the data
25% of the data
75% of the data
Tags
CCSS.6.SP.B.4
CCSS.HSS.ID.A.1
2.
MULTIPLE CHOICE QUESTION
30 sec • 1 pt
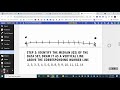
What is the first step in creating a box and whisker plot?
Identify the minimum and maximum
Draw a number line
Arrange data from least to greatest
Identify the median
Tags
CCSS.6.SP.B.4
CCSS.HSS.ID.A.1
3.
MULTIPLE CHOICE QUESTION
30 sec • 1 pt
What is the median also known as in a box and whisker plot?
Quartile 3
Quartile 2
Quartile 1
Quartile 4
Tags
CCSS.6.SP.B.4
CCSS.HSS.ID.A.1
4.
MULTIPLE CHOICE QUESTION
30 sec • 1 pt
How is the interquartile range calculated in a box and whisker plot?
Maximum minus minimum
Upper quartile minus lower quartile
Median minus minimum
Maximum minus median
Tags
CCSS.6.SP.B.4
CCSS.HSS.ID.A.1
5.
MULTIPLE CHOICE QUESTION
30 sec • 1 pt
How many students took the course and passed the test according to the two-way frequency table?
28
22
20
16
Tags
CCSS.8.SP.A.4
6.
MULTIPLE CHOICE QUESTION
30 sec • 1 pt
How many students did not take the course and failed the test?
16
20
6
22
Tags
CCSS.8.SP.A.4
7.
MULTIPLE CHOICE QUESTION
30 sec • 1 pt
What is the total number of students surveyed according to the two-way frequency table?
40
50
30
60
Tags
CCSS.6.SP.B.5A
Access all questions and much more by creating a free account
Create resources
Host any resource
Get auto-graded reports
Continue with Google

Continue with Email
Continue with Classlink
Continue with Clever
or continue with
Microsoft
%20(1).png)
Apple
Others
Already have an account?
