Exploring Scaled Picture Graphs in 3rd Grade Math
Interactive Video
•
Mathematics
•
1st - 5th Grade
•
Practice Problem
•
Hard
+8
Standards-aligned

Ethan Morris
Used 1+ times
FREE Resource
Standards-aligned
Read more
10 questions
Show all answers
1.
MULTIPLE CHOICE QUESTION
30 sec • 1 pt
What item from the math kit are the students asked to use for the counting exercise?
Compass
Protractor
Colored calculator
Ruler
Tags
CCSS.2.MD.A.3
2.
MULTIPLE CHOICE QUESTION
30 sec • 1 pt
What is the next number in the sequence if you start counting by tens from 50?
60
70
90
80
Tags
CCSS.1.NBT.A.1
3.
MULTIPLE CHOICE QUESTION
30 sec • 1 pt
If you subtract 5 starting from 125, what number do you get after two subtractions?
110
115
105
120
Tags
CCSS.1.NBT.C.5
4.
MULTIPLE CHOICE QUESTION
30 sec • 1 pt
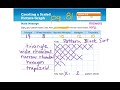
How many narrow rhombuses are represented in the scaled picture graph?
14
10
8
12
5.
MULTIPLE CHOICE QUESTION
30 sec • 1 pt
What does each 'X' symbol represent in the scaled picture graph?
Four blocks
Two blocks
One block
Three blocks
6.
MULTIPLE CHOICE QUESTION
30 sec • 1 pt
How many cars were washed on Saturday according to the data provided?
18
14
16
20
Tags
CCSS.4.MD.B.4
7.
MULTIPLE CHOICE QUESTION
30 sec • 1 pt
What does each rectangle symbolize in the car wash data graph?
Two cars
Three cars
Four cars
Five cars
Tags
CCSS.HSN.VM.C.6
Access all questions and much more by creating a free account
Create resources
Host any resource
Get auto-graded reports
Continue with Google

Continue with Email
Continue with Classlink
Continue with Clever
or continue with
Microsoft
%20(1).png)
Apple
Others
Already have an account?
Similar Resources on Wayground

6 questions
Image Interpretation and Description
Interactive video
•
3rd - 6th Grade
11 questions
Words About Maps and Globes Quiz
Interactive video
•
1st - 3rd Grade
6 questions
CLEAN : LEGO creations take center stage in Art
Interactive video
•
1st - 2nd Grade
6 questions
UPIN IPIN
Interactive video
•
KG
6 questions
WES Ipad Rules and Expectations Quiz
Interactive video
•
1st - 5th Grade
8 questions
Identifying Patterns when Skip Counting by Hundreds
Interactive video
•
1st - 6th Grade
6 questions
PE fitness circuit ideas › Stamina | Mountain climbs
Interactive video
•
1st - 6th Grade
2 questions
Using Subtraction to Measure the Difference in Height
Interactive video
•
1st - 6th Grade
Popular Resources on Wayground
7 questions
History of Valentine's Day
Interactive video
•
4th Grade
15 questions
Fractions on a Number Line
Quiz
•
3rd Grade
20 questions
Equivalent Fractions
Quiz
•
3rd Grade
25 questions
Multiplication Facts
Quiz
•
5th Grade
22 questions
fractions
Quiz
•
3rd Grade
15 questions
Valentine's Day Trivia
Quiz
•
3rd Grade
20 questions
Main Idea and Details
Quiz
•
5th Grade
20 questions
Context Clues
Quiz
•
6th Grade
Discover more resources for Mathematics
15 questions
Fractions on a Number Line
Quiz
•
3rd Grade
20 questions
Equivalent Fractions
Quiz
•
3rd Grade
25 questions
Multiplication Facts
Quiz
•
5th Grade
22 questions
fractions
Quiz
•
3rd Grade
15 questions
Equivalent Fractions
Quiz
•
4th Grade
18 questions
Comparing Fractions with same numerator or denominator
Quiz
•
3rd Grade
20 questions
Classifying Triangles
Quiz
•
5th Grade
10 questions
Area
Quiz
•
3rd Grade