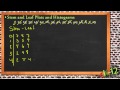
Understanding Stem and Leaf Plots and Histograms
Interactive Video
•
Mathematics, Science
•
5th - 8th Grade
•
Practice Problem
•
Medium

Emma Peterson
Used 1+ times
FREE Resource
Read more
10 questions
Show all answers
1.
MULTIPLE CHOICE QUESTION
30 sec • 1 pt
What is the primary purpose of using stem and leaf plots and histograms?
To create artistic representations of data
To hide specific data points
To organize data for easier understanding
To make data look more complex
2.
MULTIPLE CHOICE QUESTION
30 sec • 1 pt
In a stem and leaf plot, what does the 'stem' represent?
The decimal place of the numbers
The hundreds place of the numbers
The tens place of the numbers
The units place of the numbers
3.
MULTIPLE CHOICE QUESTION
30 sec • 1 pt
How are numbers organized on the 'leaf' side of a stem and leaf plot?
By their decimal place
By their hundreds place
By their units place
By their tens place
4.
MULTIPLE CHOICE QUESTION
30 sec • 1 pt
What can be immediately observed from a stem and leaf plot?
The range of the data points
The exact value of each data point
The mode of the data points
The average of the data points
5.
MULTIPLE CHOICE QUESTION
30 sec • 1 pt
What is a key advantage of using a histogram over a stem and leaf plot?
It is more complex to create
It shows the exact value of each data point
It provides a quick glance at data distribution
It hides the data distribution
6.
MULTIPLE CHOICE QUESTION
30 sec • 1 pt
In a histogram, what does the height of each bar represent?
The average of the data points
The exact value of the data points
The frequency of data points in a range
The sum of the data points
7.
MULTIPLE CHOICE QUESTION
30 sec • 1 pt
What is lost when using a histogram instead of a stem and leaf plot?
The range of data points
The frequency of data points
The specific values of data points
The overall data distribution
Access all questions and much more by creating a free account
Create resources
Host any resource
Get auto-graded reports
Continue with Google

Continue with Email
Continue with Classlink
Continue with Clever
or continue with
Microsoft
%20(1).png)
Apple
Others
Already have an account?
Popular Resources on Wayground

15 questions
Fractions on a Number Line
Quiz
•
3rd Grade
10 questions
Probability Practice
Quiz
•
4th Grade
15 questions
Probability on Number LIne
Quiz
•
4th Grade
20 questions
Equivalent Fractions
Quiz
•
3rd Grade
25 questions
Multiplication Facts
Quiz
•
5th Grade
22 questions
fractions
Quiz
•
3rd Grade
6 questions
Appropriate Chromebook Usage
Lesson
•
7th Grade
10 questions
Greek Bases tele and phon
Quiz
•
6th - 8th Grade
Discover more resources for Mathematics
25 questions
Multiplication Facts
Quiz
•
5th Grade
10 questions
Multiplying Fractions
Quiz
•
5th Grade
20 questions
Writing Algebraic Expressions
Quiz
•
6th Grade
10 questions
Adding and Subtracting Decimals
Quiz
•
5th Grade
20 questions
Ratios/Rates and Unit Rates
Quiz
•
6th Grade
15 questions
Rounding Decimals
Quiz
•
5th Grade
14 questions
Volume of rectangular prisms
Quiz
•
7th Grade
15 questions
Graphing Inequalities
Quiz
•
7th - 9th Grade