Data Interpretation and Analysis
Interactive Video
•
Mathematics, Science, Education
•
5th - 8th Grade
•
Practice Problem
•
Medium

Aiden Montgomery
Used 25+ times
FREE Resource
Read more
10 questions
Show all answers
1.
MULTIPLE CHOICE QUESTION
30 sec • 1 pt
What is a bar graph primarily used for?
Comparing numerical data
Comparing categorical data
Showing trends over time
Displaying geographical data
2.
MULTIPLE CHOICE QUESTION
30 sec • 1 pt
In a bar graph, what does the length of the bar represent?
The number of categories
The total number of data points
The value of the category
The average value of the data
3.
MULTIPLE CHOICE QUESTION
30 sec • 1 pt
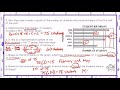
How many red tiles are in the brown paper sack?
18
19
20
21
4.
MULTIPLE CHOICE QUESTION
30 sec • 1 pt
What is the total number of tiles in the brown paper sack?
60
55
45
50
5.
MULTIPLE CHOICE QUESTION
30 sec • 1 pt
What percentage of the tiles are blue?
20%
14%
16%
18%
6.
MULTIPLE CHOICE QUESTION
30 sec • 1 pt
Which two colors make up more than 60% of the sample?
Red and Blue
Green and Yellow
Red and Green
Blue and Yellow
7.
MULTIPLE CHOICE QUESTION
30 sec • 1 pt
How many students have birthdays in March according to Mrs. Reynolds' graph?
15
16
17
18
Access all questions and much more by creating a free account
Create resources
Host any resource
Get auto-graded reports
Continue with Google

Continue with Email
Continue with Classlink
Continue with Clever
or continue with
Microsoft
%20(1).png)
Apple
Others
Already have an account?
Popular Resources on Wayground

15 questions
Fractions on a Number Line
Quiz
•
3rd Grade
20 questions
Equivalent Fractions
Quiz
•
3rd Grade
25 questions
Multiplication Facts
Quiz
•
5th Grade
22 questions
fractions
Quiz
•
3rd Grade
20 questions
Main Idea and Details
Quiz
•
5th Grade
20 questions
Context Clues
Quiz
•
6th Grade
15 questions
Equivalent Fractions
Quiz
•
4th Grade
20 questions
Figurative Language Review
Quiz
•
6th Grade
Discover more resources for Mathematics
25 questions
Multiplication Facts
Quiz
•
5th Grade
20 questions
Exponents
Quiz
•
6th Grade
22 questions
distributive property
Quiz
•
7th Grade
10 questions
Multiplying Fractions
Quiz
•
5th Grade
15 questions
Distributive Property & Review
Quiz
•
6th Grade
20 questions
Writing Algebraic Expressions
Quiz
•
6th Grade
20 questions
Ratios/Rates and Unit Rates
Quiz
•
6th Grade
20 questions
Writing and Graphing Inequalities
Quiz
•
6th Grade