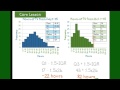
Interpreting and Comparing Histograms
Interactive Video
•
Mathematics
•
6th - 10th Grade
•
Practice Problem
•
Medium
+7
Standards-aligned

Aiden Montgomery
Used 7+ times
FREE Resource
Standards-aligned
10 questions
Show all answers
1.
MULTIPLE CHOICE QUESTION
30 sec • 1 pt
What happens to the mean and median in a symmetrical histogram?
They become identical
They move further apart
Only the mean is affected
Only the median is affected
2.
MULTIPLE CHOICE QUESTION
30 sec • 1 pt
In a left-skewed graph, how do the mean and median compare to the mode?
There is no relationship
Mean is greater than median, which is greater than the mode
Mean and median are greater than the mode
Mean and median are less than the mode
Tags
CCSS.6.SP.B.5D
CCSS.HSS.ID.A.2
3.
MULTIPLE CHOICE QUESTION
30 sec • 1 pt
What does a right-skewed histogram indicate about the mean and median?
No specific relationship
Mean is less than the median
Median is less than the mean
Mean and median are equal
Tags
CCSS.6.SP.B.5D
CCSS.HSS.ID.A.2
4.
MULTIPLE CHOICE QUESTION
30 sec • 1 pt
What does the spread of a graph tell us?
The average value of the data
The highest data point only
The consistency of the data
The total number of data points
Tags
CCSS.6.SP.A.2
5.
MULTIPLE CHOICE QUESTION
30 sec • 1 pt
How is the interquartile range calculated?
Quartile 3 minus Quartile 1
Quartile 3 plus Quartile 1
Quartile 2 minus Quartile 1
Quartile 1 minus Quartile 3
Tags
CCSS.6.SP.B.5C
6.
MULTIPLE CHOICE QUESTION
30 sec • 1 pt
What is the significance of the interquartile range in a dataset?
It shows the range of most extreme values
It indicates the middle 50% of the data
It calculates the average value
It identifies all outliers
Tags
CCSS.6.SP.B.5C
7.
MULTIPLE CHOICE QUESTION
30 sec • 1 pt
What formula is used to find outliers above Quartile 3?
Quartile 3 plus 1.5 times interquartile range
Quartile 1 minus 1.5 times interquartile range
Quartile 1 plus 1.5 times interquartile range
Quartile 3 minus 1.5 times interquartile range
Access all questions and much more by creating a free account
Create resources
Host any resource
Get auto-graded reports
Continue with Google

Continue with Email
Continue with Classlink
Continue with Clever
or continue with
Microsoft
%20(1).png)
Apple
Others
Already have an account?
Popular Resources on Wayground

15 questions
Fractions on a Number Line
Quiz
•
3rd Grade
20 questions
Equivalent Fractions
Quiz
•
3rd Grade
25 questions
Multiplication Facts
Quiz
•
5th Grade
54 questions
Analyzing Line Graphs & Tables
Quiz
•
4th Grade
22 questions
fractions
Quiz
•
3rd Grade
20 questions
Main Idea and Details
Quiz
•
5th Grade
20 questions
Context Clues
Quiz
•
6th Grade
15 questions
Equivalent Fractions
Quiz
•
4th Grade
Discover more resources for Mathematics
22 questions
distributive property
Quiz
•
7th Grade
18 questions
Angle Relationships
Quiz
•
7th Grade
15 questions
Distributive Property & Review
Quiz
•
6th Grade
20 questions
Writing Algebraic Expressions
Quiz
•
6th Grade
20 questions
How Some Friendships Last — and Others Don’t Video Questions
Quiz
•
7th Grade
14 questions
finding slope from a graph
Quiz
•
8th Grade
20 questions
Ratios/Rates and Unit Rates
Quiz
•
6th Grade
18 questions
Handbook Refresher Quiz
Quiz
•
7th Grade