- Resource Library
- Math
- Probability And Statistics
- Curve Of Best Fit
- Analyzing Scatter Plots And Lines Of Best Fit
Analyzing Scatter Plots and Lines of Best Fit
Interactive Video
•
Mathematics
•
6th - 10th Grade
•
Practice Problem
•
Hard
+2
Standards-aligned

Aiden Montgomery
FREE Resource
Standards-aligned
Read more
10 questions
Show all answers
1.
MULTIPLE CHOICE QUESTION
30 sec • 1 pt
What does a scatter plot visually represent?
The difference between two variables
A visual representation of data showing patterns and relationships between variables
A way to represent data in three dimensions
A method to calculate the mean of a dataset
Tags
CCSS.8.SP.A.1
2.
MULTIPLE CHOICE QUESTION
30 sec • 1 pt
What is the purpose of a line of best fit?
To precisely calculate the value of one variable based on another
To draw a perfect line through all data points
To visually represent the average of all data points
To model data and make predictions about relationships between variables
Tags
CCSS.HSF-LE.A.1B
3.
MULTIPLE CHOICE QUESTION
30 sec • 1 pt
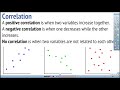
What indicates a positive correlation in a scatter plot?
A perfectly horizontal line
Randomly scattered dots with no clear pattern
A downward sloping line
A line that moves upwards as one variable increases
Tags
CCSS.HSS.ID.B.5
4.
MULTIPLE CHOICE QUESTION
30 sec • 1 pt
What does a negative correlation imply?
As one variable increases, the other also increases
The variables are unrelated but have a constant sum
As one variable increases, the other decreases
There is no relationship between the variables
Tags
CCSS.HSS.ID.B.5
5.
MULTIPLE CHOICE QUESTION
30 sec • 1 pt
What does it mean if there's no correlation in a scatter plot?
There's no discernible pattern or relationship between the variables
The variables increase at the same rate
One variable increases as the other decreases
The data points form a perfect circle
Tags
CCSS.HSS.ID.B.5
6.
MULTIPLE CHOICE QUESTION
30 sec • 1 pt
What is the significance of the direction of a line of best fit?
It is purely aesthetic and has no mathematical significance
It shows the strength of the correlation between variables
It determines the exact values of the data points
It indicates the type of correlation (positive, negative, or none) between the variables
Tags
CCSS.8.SP.A.2
7.
MULTIPLE CHOICE QUESTION
30 sec • 1 pt
How can you predict values using a line of best fit?
By estimating the value at a given point on the line
By calculating the slope of the line
By counting the number of data points
By drawing a curve through all the data points
Tags
CCSS.HSF.IF.A.2
Access all questions and much more by creating a free account
Create resources
Host any resource
Get auto-graded reports
Continue with Google

Continue with Email
Continue with Classlink
Continue with Clever
or continue with
Microsoft
%20(1).png)
Apple
Others
Already have an account?
