Understanding Measures of Central Tendency and Data Range
Interactive Video
•
Mathematics, Science, Education
•
6th - 8th Grade
•
Practice Problem
•
Hard

Ethan Morris
FREE Resource
Read more
10 questions
Show all answers
1.
MULTIPLE CHOICE QUESTION
30 sec • 1 pt
What is the mean in statistics?
The difference between the highest and lowest values
The average of all data points
The most frequently occurring number
The middle value in a data set
2.
MULTIPLE CHOICE QUESTION
30 sec • 1 pt
How do you find the median in a data set with an even number of values?
Select the most frequent number
Find the average of the two middle numbers
Choose the largest value
Choose the smallest value
3.
MULTIPLE CHOICE QUESTION
30 sec • 1 pt
What does the mode represent in a data set?
The middle value when data is ordered
The average of all data points
The range of the data set
The most frequently occurring number
4.
MULTIPLE CHOICE QUESTION
30 sec • 1 pt
How is the range of a data set calculated?
By averaging the two middle numbers
By finding the difference between the largest and smallest values
By identifying the most frequent number
By adding all data points together
5.
MULTIPLE CHOICE QUESTION
30 sec • 1 pt
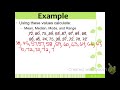
What is the first step in solving the example problem?
Add all numbers together
Calculate the range
Reorder the list from smallest to largest
Find the mode
6.
MULTIPLE CHOICE QUESTION
30 sec • 1 pt
In the example, what is the mean of the data set?
72
65
63.5
37
7.
MULTIPLE CHOICE QUESTION
30 sec • 1 pt
What is the median of the example data set?
65
37
63.5
72
Access all questions and much more by creating a free account
Create resources
Host any resource
Get auto-graded reports
Continue with Google

Continue with Email
Continue with Classlink
Continue with Clever
or continue with
Microsoft
%20(1).png)
Apple
Others
Already have an account?
