Understanding Distributions and Transformations
Interactive Video
•
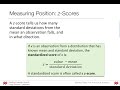
Mathematics
•
9th - 12th Grade
•
Practice Problem
•
Hard
+1
Standards-aligned

Aiden Montgomery
FREE Resource
Standards-aligned
Read more
10 questions
Show all answers
1.
MULTIPLE CHOICE QUESTION
30 sec • 1 pt
What is a percentile used for in a distribution?
To calculate the standard deviation
To measure the average value
To describe the location of a value
To determine the spread of data
Tags
CCSS.6.SP.B.5C
2.
MULTIPLE CHOICE QUESTION
30 sec • 1 pt
If Jenny's test score is at the 88th percentile, what does this mean?
88% of scores are lower than or equal to hers
88% of scores are higher than hers
She scored 88 out of 100
Her score is the highest in the class
Tags
CCSS.HSS.ID.A.4
3.
MULTIPLE CHOICE QUESTION
30 sec • 1 pt
What does a positive z-score indicate?
The value is the median
The value is at the mean
The value is above the mean
The value is below the mean
Tags
CCSS.HSS.ID.A.4
4.
MULTIPLE CHOICE QUESTION
30 sec • 1 pt
How is a z-score calculated?
By multiplying the observation by the mean
By adding the mean to the observation
By subtracting the mean from the observation and dividing by the standard deviation
By dividing the observation by the mean
5.
MULTIPLE CHOICE QUESTION
30 sec • 1 pt
What happens to the mean and median when a constant is added to all values in a distribution?
They remain unchanged
Only the mean changes
They both increase by the constant
They both decrease by the constant
6.
MULTIPLE CHOICE QUESTION
30 sec • 1 pt
Does multiplying all values in a distribution by a constant affect the shape of the distribution?
Yes, but only if the constant is greater than 1
No, it does not change the shape
No, unless the constant is negative
Yes, it changes the shape
7.
MULTIPLE CHOICE QUESTION
30 sec • 1 pt
What is the effect of subtracting a constant from all values in a distribution on the variability?
It makes variability zero
It does not affect variability
It decreases variability
It increases variability
Tags
CCSS.2.MD.A.2
Access all questions and much more by creating a free account
Create resources
Host any resource
Get auto-graded reports
Continue with Google

Continue with Email
Continue with Classlink
Continue with Clever
or continue with
Microsoft
%20(1).png)
Apple
Others
Already have an account?
Popular Resources on Wayground

15 questions
Fractions on a Number Line
Quiz
•
3rd Grade
20 questions
Equivalent Fractions
Quiz
•
3rd Grade
25 questions
Multiplication Facts
Quiz
•
5th Grade
54 questions
Analyzing Line Graphs & Tables
Quiz
•
4th Grade
22 questions
fractions
Quiz
•
3rd Grade
20 questions
Main Idea and Details
Quiz
•
5th Grade
20 questions
Context Clues
Quiz
•
6th Grade
15 questions
Equivalent Fractions
Quiz
•
4th Grade
Discover more resources for Mathematics
20 questions
Graphing Inequalities on a Number Line
Quiz
•
6th - 9th Grade
18 questions
SAT Prep: Ratios, Proportions, & Percents
Quiz
•
9th - 10th Grade
12 questions
Exponential Growth and Decay
Quiz
•
9th Grade
12 questions
Parallel Lines Cut by a Transversal
Quiz
•
10th Grade
12 questions
Add and Subtract Polynomials
Quiz
•
9th - 12th Grade
15 questions
Combine Like Terms and Distributive Property
Quiz
•
8th - 9th Grade
20 questions
Function or Not a Function
Quiz
•
8th - 9th Grade
10 questions
Elijah McCoy: Innovations and Impact in Black History
Interactive video
•
6th - 10th Grade