Data Distribution and Analysis Concepts
Interactive Video
•
Mathematics, Science
•
6th - 8th Grade
•
Practice Problem
•
Easy

Emma Peterson
Used 1+ times
FREE Resource
Read more
10 questions
Show all answers
1.
MULTIPLE CHOICE QUESTION
30 sec • 1 pt
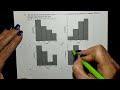
How many zeros should be stacked in the dot plot for the given data set?
Four
Six
Seven
Five
2.
MULTIPLE CHOICE QUESTION
30 sec • 1 pt
In a left-skewed distribution, where is the mean located relative to the median?
Unrelated to the median
To the left of the median
To the right of the median
Equal to the median
3.
MULTIPLE CHOICE QUESTION
30 sec • 1 pt
What type of correlation is indicated by a scatter plot where the data points trend downward from left to right?
No correlation
Negative correlation
Perfect correlation
Positive correlation
4.
MULTIPLE CHOICE QUESTION
30 sec • 1 pt
What is the line of best fit equation format used in scatter plots?
y = x^2 + c
y = a/x
y = mx + b
y = ax^2 + bx + c
5.
MULTIPLE CHOICE QUESTION
30 sec • 1 pt
When analyzing a frequency table, what is the first step to eliminate incorrect options?
Look for outliers
Verify the range of data
Count the number of items in each category
Check the total number of items
6.
MULTIPLE CHOICE QUESTION
30 sec • 1 pt
What does a smaller interquartile range (IQR) indicate about a data set?
No change
More variability
Less consistency
More consistency
7.
MULTIPLE CHOICE QUESTION
30 sec • 1 pt
If a histogram is skewed to the right, what can be said about the mean compared to the median?
Mean is less than median
Mean equals median
Mean is unrelated to median
Mean is greater than median
Access all questions and much more by creating a free account
Create resources
Host any resource
Get auto-graded reports
Continue with Google

Continue with Email
Continue with Classlink
Continue with Clever
or continue with
Microsoft
%20(1).png)
Apple
Others
Already have an account?
Popular Resources on Wayground

15 questions
Fractions on a Number Line
Quiz
•
3rd Grade
20 questions
Equivalent Fractions
Quiz
•
3rd Grade
25 questions
Multiplication Facts
Quiz
•
5th Grade
54 questions
Analyzing Line Graphs & Tables
Quiz
•
4th Grade
22 questions
fractions
Quiz
•
3rd Grade
20 questions
Main Idea and Details
Quiz
•
5th Grade
20 questions
Context Clues
Quiz
•
6th Grade
15 questions
Equivalent Fractions
Quiz
•
4th Grade
Discover more resources for Mathematics
22 questions
distributive property
Quiz
•
7th Grade
18 questions
Angle Relationships
Quiz
•
7th Grade
15 questions
Distributive Property & Review
Quiz
•
6th Grade
20 questions
Writing Algebraic Expressions
Quiz
•
6th Grade
20 questions
How Some Friendships Last — and Others Don’t Video Questions
Quiz
•
7th Grade
14 questions
finding slope from a graph
Quiz
•
8th Grade
20 questions
Ratios/Rates and Unit Rates
Quiz
•
6th Grade
18 questions
Handbook Refresher Quiz
Quiz
•
7th Grade