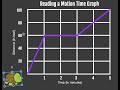
Understanding Motion Time Graphs
Interactive Video
•
Physics, Science
•
5th - 8th Grade
•
Practice Problem
•
Medium

Sophia Harris
Used 58+ times
FREE Resource
Read more
10 questions
Show all answers
1.
MULTIPLE CHOICE QUESTION
30 sec • 1 pt
What is the primary purpose of a motion time graph?
To track the velocity of an object
To compare the speed of two different objects
To keep track of data based on the motion of an object
To measure the acceleration of an object
2.
MULTIPLE CHOICE QUESTION
30 sec • 1 pt
What is the main difference between a motion time graph and a velocity time graph?
They are the same
Motion time graph tracks speed, velocity time graph tracks position
Motion time graph tracks acceleration, velocity time graph tracks position
Motion time graph tracks position, velocity time graph tracks speed
3.
MULTIPLE CHOICE QUESTION
30 sec • 1 pt
In the example of Tyler the turtle, what does the x-axis represent?
Time in minutes
Distance in feet
Speed in miles per hour
Acceleration in meters per second squared
4.
MULTIPLE CHOICE QUESTION
30 sec • 1 pt
How far did Tyler move in the first minute?
60 feet
40 feet
80 feet
20 feet
5.
MULTIPLE CHOICE QUESTION
30 sec • 1 pt
What does a horizontal line on a motion time graph indicate?
Increasing speed
Constant speed
No motion
Decreasing speed
6.
MULTIPLE CHOICE QUESTION
30 sec • 1 pt
What does a straight diagonal line on a motion time graph signify?
Decreasing speed
Increasing speed
No motion
Constant speed
7.
MULTIPLE CHOICE QUESTION
30 sec • 1 pt
During which time interval did Tyler not move at all?
4 to 5 minutes
3 to 4 minutes
1 to 3 minutes
0 to 1 minute
Access all questions and much more by creating a free account
Create resources
Host any resource
Get auto-graded reports
Continue with Google

Continue with Email
Continue with Classlink
Continue with Clever
or continue with
Microsoft
%20(1).png)
Apple
Others
Already have an account?
Popular Resources on Wayground

15 questions
Fractions on a Number Line
Quiz
•
3rd Grade
20 questions
Equivalent Fractions
Quiz
•
3rd Grade
25 questions
Multiplication Facts
Quiz
•
5th Grade
54 questions
Analyzing Line Graphs & Tables
Quiz
•
4th Grade
22 questions
fractions
Quiz
•
3rd Grade
20 questions
Main Idea and Details
Quiz
•
5th Grade
20 questions
Context Clues
Quiz
•
6th Grade
15 questions
Equivalent Fractions
Quiz
•
4th Grade
Discover more resources for Physics
20 questions
Thermal Energy
Quiz
•
5th - 8th Grade
15 questions
Magnets
Quiz
•
5th Grade
24 questions
PS.8b Newtons Laws
Quiz
•
8th Grade
14 questions
Electromagnetic Spectrum
Quiz
•
8th Grade
20 questions
Distance and Displacement
Quiz
•
6th - 8th Grade
15 questions
Electricity and Magnetism
Quiz
•
8th Grade
24 questions
Waves, Parts of Waves and Wave Properties
Quiz
•
5th - 7th Grade
20 questions
Force & Net Force
Quiz
•
6th Grade