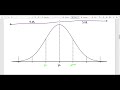
Understanding Normal Distribution and Z-Scores
Interactive Video
•
Mathematics, Science, Education
•
9th - 12th Grade
•
Practice Problem
•
Hard

Ethan Morris
FREE Resource
Read more
10 questions
Show all answers
1.
MULTIPLE CHOICE QUESTION
30 sec • 1 pt
What shape is typically associated with a normal distribution?
Bimodal
Uniform
Bell-shaped
Skewed
2.
MULTIPLE CHOICE QUESTION
30 sec • 1 pt
Which of the following is NOT a property of a normal distribution?
Unimodal
Symmetric around the mean
Mean, median, and mode are equal
Always skewed to the right
3.
MULTIPLE CHOICE QUESTION
30 sec • 1 pt
According to the empirical rule, what percentage of data falls within one standard deviation of the mean?
50%
68%
95%
99.7%
4.
MULTIPLE CHOICE QUESTION
30 sec • 1 pt
How much of the data is expected to lie within two standard deviations of the mean in a normal distribution?
68%
95%
99.7%
100%
5.
MULTIPLE CHOICE QUESTION
30 sec • 1 pt
What is the percentage of data that lies beyond three standard deviations from the mean in a normal distribution?
4.7%
0.3%
2.5%
5%
6.
MULTIPLE CHOICE QUESTION
30 sec • 1 pt
What does a z-score represent in a dataset?
The absolute value of a data point
The mode of the dataset
The median of the dataset
The number of standard deviations a data point is from the mean
7.
MULTIPLE CHOICE QUESTION
30 sec • 1 pt
If a data point has a z-score of -2, what does this indicate?
The data point is 2 standard deviations above the mean
The data point is 2 standard deviations below the mean
The data point is at the mean
The data point is an outlier
Access all questions and much more by creating a free account
Create resources
Host any resource
Get auto-graded reports
Continue with Google

Continue with Email
Continue with Classlink
Continue with Clever
or continue with
Microsoft
%20(1).png)
Apple
Others
Already have an account?
