Understanding Normal Distribution and Z-scores
Interactive Video
•
Mathematics, Science
•
9th - 12th Grade
•
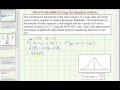
Practice Problem
•
Hard

Liam Anderson
FREE Resource
Read more
10 questions
Show all answers
1.
MULTIPLE CHOICE QUESTION
30 sec • 1 pt
What is the mean number of daily lightbulb replacement requests at the university?
33
11
49
16
2.
MULTIPLE CHOICE QUESTION
30 sec • 1 pt
What is the standard deviation of the daily lightbulb replacement requests?
11
33
49
16
3.
MULTIPLE CHOICE QUESTION
30 sec • 1 pt
According to the empirical rule, what percentage of data falls within one standard deviation of the mean?
68%
95%
99.7%
34%
4.
MULTIPLE CHOICE QUESTION
30 sec • 1 pt
How many standard deviations below the mean is the value 16?
4
3
2
1
5.
MULTIPLE CHOICE QUESTION
30 sec • 1 pt
What is the approximate percentage of requests between 16 and 49?
95%
68%
49.85%
34%
6.
MULTIPLE CHOICE QUESTION
30 sec • 1 pt
What does a Z-score represent in a normal distribution?
The range of the data
The median of the data
The number of standard deviations a value is from the mean
The mean of the data
7.
MULTIPLE CHOICE QUESTION
30 sec • 1 pt
What is the Z-score for the value 16?
-3
-2
-1
0
Access all questions and much more by creating a free account
Create resources
Host any resource
Get auto-graded reports
Continue with Google

Continue with Email
Continue with Classlink
Continue with Clever
or continue with
Microsoft
%20(1).png)
Apple
Others
Already have an account?
