Distance vs. Time Graphs
Authored by Melissa Humphries
Science
7th Grade
NGSS covered
Used 13+ times

AI Actions
Add similar questions
Adjust reading levels
Convert to real-world scenario
Translate activity
More...
Content View
Student View
15 questions
Show all answers
1.
MULTIPLE CHOICE QUESTION
30 sec • 1 pt

Which of the following describes the motion of the car?
The car is increasing in speed.
The car is decreasing in speed.
The car has no motion.
The car is moving at a constant speed.
Tags
NGSS.MS-PS3-1
2.
MULTIPLE CHOICE QUESTION
30 sec • 1 pt

Which runner stopped for a rest?
3.
MULTIPLE CHOICE QUESTION
30 sec • 1 pt

How long did one of the runner's rest?
4.
MULTIPLE CHOICE QUESTION
30 sec • 1 pt

What is happening at A?
Tags
NGSS.MS-PS3-1
NGSS.MS-PS3-5
5.
MULTIPLE CHOICE QUESTION
30 sec • 1 pt
Which runner stopped for a rest?
6.
MULTIPLE CHOICE QUESTION
30 sec • 1 pt

What does this graph represent?
Tags
NGSS.MS-PS3-1
7.
MULTIPLE CHOICE QUESTION
1 min • 1 pt
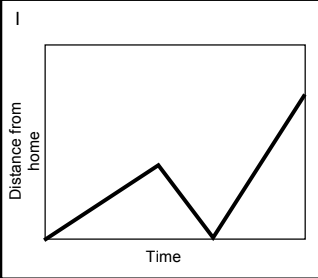
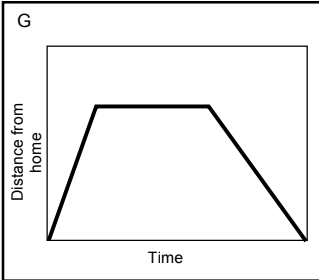
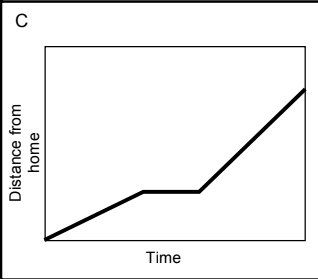
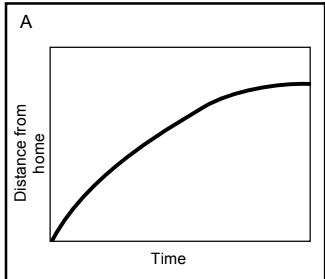
Susie went to the store, when she got there she realized that she forgot her wallet and returned home.
Which graph matches this motion?


Access all questions and much more by creating a free account
Create resources
Host any resource
Get auto-graded reports
Continue with Google

Continue with Email
Continue with Classlink
Continue with Clever
or continue with
Microsoft
%20(1).png)
Apple
Others
Already have an account?
Similar Resources on Wayground

15 questions
Ecological Relationship
Quiz
•
7th Grade
10 questions
Acids,Bases and Salt
Quiz
•
7th Grade
18 questions
Nonrenewable energy quiz
Quiz
•
7th Grade
15 questions
Earth History Investigation 3 Deposition
Quiz
•
7th - 8th Grade
10 questions
CPR
Quiz
•
1st - 7th Grade
10 questions
Form 3: Chapter 9 - Space Weather
Quiz
•
7th Grade
10 questions
Phases of Matter Quiz
Quiz
•
7th - 8th Grade
12 questions
Forces
Quiz
•
6th - 8th Grade
Popular Resources on Wayground
15 questions
Fractions on a Number Line
Quiz
•
3rd Grade
20 questions
Equivalent Fractions
Quiz
•
3rd Grade
25 questions
Multiplication Facts
Quiz
•
5th Grade
22 questions
fractions
Quiz
•
3rd Grade
20 questions
Main Idea and Details
Quiz
•
5th Grade
20 questions
Context Clues
Quiz
•
6th Grade
15 questions
Equivalent Fractions
Quiz
•
4th Grade
20 questions
Figurative Language Review
Quiz
•
6th Grade
Discover more resources for Science
33 questions
Grade 6 Quarter 3 PMA 5 Review
Quiz
•
6th - 8th Grade
12 questions
Ecological Succession
Quiz
•
7th Grade
12 questions
Newton's Laws of Motion
Lesson
•
6th - 8th Grade
10 questions
Exploring the Rock Cycle: Types and Formation
Interactive video
•
6th - 8th Grade
10 questions
Exploring the Layers of the Earth
Interactive video
•
6th - 10th Grade
22 questions
Wave Properties
Lesson
•
7th Grade
20 questions
Food Chains & Food Webs
Quiz
•
5th - 7th Grade
20 questions
Earth's Spheres
Quiz
•
6th - 8th Grade