Probability and IQ Score Analysis
Interactive Video
•
Mathematics, Science
•
9th - 12th Grade
•
Practice Problem
•
Hard

Aiden Montgomery
FREE Resource
Read more
10 questions
Show all answers
1.
MULTIPLE CHOICE QUESTION
30 sec • 1 pt
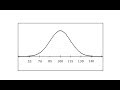
What is the mean IQ score in a normal distribution?
90
100
120
110
2.
MULTIPLE CHOICE QUESTION
30 sec • 1 pt
Which tool is used on the TI-84 calculator to find the probability of an IQ greater than 90?
Z-Score Table
Normal CDF
Normal PDF
Empirical Rule
3.
MULTIPLE CHOICE QUESTION
30 sec • 1 pt
What is the probability of having an IQ greater than 90?
0.0098
0.6306
0.9088
0.7475
4.
MULTIPLE CHOICE QUESTION
30 sec • 1 pt
To find the probability of an IQ less than 120, what is exaggerated in the calculator?
Mean
Lower bound
Upper bound
Standard deviation
5.
MULTIPLE CHOICE QUESTION
30 sec • 1 pt
What is the probability of having an IQ less than 120?
0.7475
0.6306
0.9088
0.0098
6.
MULTIPLE CHOICE QUESTION
30 sec • 1 pt
How many people in a sample of 1200 are expected to have an IQ less than 105?
908
120
757
630
7.
MULTIPLE CHOICE QUESTION
30 sec • 1 pt
What is the probability of having an IQ less than 105?
0.7475
0.0098
0.6306
0.9088
Access all questions and much more by creating a free account
Create resources
Host any resource
Get auto-graded reports
Continue with Google

Continue with Email
Continue with Classlink
Continue with Clever
or continue with
Microsoft
%20(1).png)
Apple
Others
Already have an account?
Similar Resources on Wayground
Popular Resources on Wayground

7 questions
History of Valentine's Day
Interactive video
•
4th Grade
15 questions
Fractions on a Number Line
Quiz
•
3rd Grade
20 questions
Equivalent Fractions
Quiz
•
3rd Grade
25 questions
Multiplication Facts
Quiz
•
5th Grade
22 questions
fractions
Quiz
•
3rd Grade
15 questions
Valentine's Day Trivia
Quiz
•
3rd Grade
20 questions
Main Idea and Details
Quiz
•
5th Grade
20 questions
Context Clues
Quiz
•
6th Grade
Discover more resources for Mathematics
20 questions
Graphing Inequalities on a Number Line
Quiz
•
6th - 9th Grade
20 questions
Exponent Properties
Quiz
•
9th Grade
15 questions
Combine Like Terms and Distributive Property
Quiz
•
8th - 9th Grade
20 questions
Function or Not a Function
Quiz
•
8th - 9th Grade
10 questions
Factor Quadratic Expressions with Various Coefficients
Quiz
•
9th - 12th Grade
10 questions
Elijah McCoy: Innovations and Impact in Black History
Interactive video
•
6th - 10th Grade
10 questions
Evaluating Piecewise Functions Practice
Quiz
•
11th Grade
21 questions
Factoring Trinomials (a=1)
Quiz
•
9th Grade