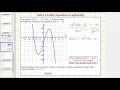
Graphical Solutions of Polynomial Equations
Interactive Video
•
Mathematics
•
8th - 10th Grade
•
Practice Problem
•
Hard
Standards-aligned

Emma Peterson
FREE Resource
Standards-aligned
Read more
10 questions
Show all answers
1.
MULTIPLE CHOICE QUESTION
30 sec • 1 pt
What is the equation we are trying to solve graphically?
x^3 + 6x - 2 = 10
x^3 + 6x - 2 = 0
x^3 + 6x - 2 = 6
x^3 + 6x - 2 = -10
2.
MULTIPLE CHOICE QUESTION
30 sec • 1 pt
What does the function g(x) represent in this problem?
An exponential function
A quadratic function
A constant function
A linear function
3.
MULTIPLE CHOICE QUESTION
30 sec • 1 pt
How do we find the solution to the equation graphically?
By finding the maximum point of f(x)
By finding the intersection points of f(x) and g(x)
By finding the y-intercepts of f(x)
By finding the x-intercepts of f(x)
4.
MULTIPLE CHOICE QUESTION
30 sec • 1 pt
What is the shape of the graph of g(x) = -10?
A parabola
A horizontal line
A cubic curve
A vertical line
Tags
CCSS.8.EE.C.8B
CCSS.HSA.REI.C.6
5.
MULTIPLE CHOICE QUESTION
30 sec • 1 pt
At what x-value do the graphs of f(x) and g(x) intersect?
x = 2
x = 0
x = 1
x = 3
Tags
CCSS.8.EE.C.8B
CCSS.HSA.REI.C.6
6.
MULTIPLE CHOICE QUESTION
30 sec • 1 pt
What is the y-coordinate of the intersection point of f(x) and g(x)?
0
-10
-2
10
Tags
CCSS.8.EE.C.8B
CCSS.HSA.REI.C.6
7.
MULTIPLE CHOICE QUESTION
30 sec • 1 pt
What ordered pair represents the intersection point of f(x) and g(x)?
(3, 0)
(3, -10)
(0, -10)
(0, 3)
Access all questions and much more by creating a free account
Create resources
Host any resource
Get auto-graded reports
Continue with Google

Continue with Email
Continue with Classlink
Continue with Clever
or continue with
Microsoft
%20(1).png)
Apple
Others
Already have an account?
