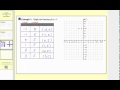
Graphing Constant Functions
Interactive Video
•
Mathematics
•
6th - 8th Grade
•
Practice Problem
•
Easy
+3
Standards-aligned

Emma Peterson
Used 1+ times
FREE Resource
Standards-aligned
Read more
10 questions
Show all answers
1.
MULTIPLE CHOICE QUESTION
30 sec • 1 pt
What is the main focus of this lesson on graphing functions?
Graphing logarithmic functions
Graphing quadratic functions
Graphing constant functions
Graphing exponential functions
Tags
CCSS.8.F.A.1
CCSS.HSF.IF.A.1
2.
MULTIPLE CHOICE QUESTION
30 sec • 1 pt
What is the output of the function p(r) = 5 for any input r?
The square of the input
The input value
The constant 5
The input plus 5
Tags
CCSS.8.F.A.1
CCSS.HSF.IF.B.5
3.
MULTIPLE CHOICE QUESTION
30 sec • 1 pt
Which of the following input values is NOT used in the example for plotting points?
4
0
3
-2
Tags
CCSS.8.F.A.1
CCSS.HSF.IF.A.1
4.
MULTIPLE CHOICE QUESTION
30 sec • 1 pt
What is the ordered pair for the input value of 1 in the function p(r) = 5?
(0, 5)
(1, 1)
(5, 1)
(1, 5)
5.
MULTIPLE CHOICE QUESTION
30 sec • 1 pt
How is the graph of a constant function described?
A vertical line
A diagonal line
A curved line
A horizontal line
Tags
CCSS.HSF-IF.C.7A
6.
MULTIPLE CHOICE QUESTION
30 sec • 1 pt
What is the vertical intercept of the function p(r) = 5?
(0, 0)
(0, 5)
(5, 5)
(5, 0)
Tags
CCSS.HSF-IF.C.7A
7.
MULTIPLE CHOICE QUESTION
30 sec • 1 pt
Why is it unnecessary to check the graph of p(r) = 5 on a calculator?
The function has no intercepts
The graph is a simple horizontal line
The function is too complex
The calculator cannot graph constant functions
Tags
CCSS.HSF-IF.C.7A
Access all questions and much more by creating a free account
Create resources
Host any resource
Get auto-graded reports
Continue with Google

Continue with Email
Continue with Classlink
Continue with Clever
or continue with
Microsoft
%20(1).png)
Apple
Others
Already have an account?
Popular Resources on Wayground

15 questions
Fractions on a Number Line
Quiz
•
3rd Grade
20 questions
Equivalent Fractions
Quiz
•
3rd Grade
25 questions
Multiplication Facts
Quiz
•
5th Grade
54 questions
Analyzing Line Graphs & Tables
Quiz
•
4th Grade
22 questions
fractions
Quiz
•
3rd Grade
20 questions
Main Idea and Details
Quiz
•
5th Grade
20 questions
Context Clues
Quiz
•
6th Grade
15 questions
Equivalent Fractions
Quiz
•
4th Grade
Discover more resources for Mathematics
22 questions
distributive property
Quiz
•
7th Grade
18 questions
Angle Relationships
Quiz
•
7th Grade
15 questions
Distributive Property & Review
Quiz
•
6th Grade
20 questions
Writing Algebraic Expressions
Quiz
•
6th Grade
20 questions
How Some Friendships Last — and Others Don’t Video Questions
Quiz
•
7th Grade
14 questions
finding slope from a graph
Quiz
•
8th Grade
20 questions
Ratios/Rates and Unit Rates
Quiz
•
6th Grade
18 questions
Handbook Refresher Quiz
Quiz
•
7th Grade