Understanding Standard Normal Distribution
Interactive Video
•
Mathematics
•
10th - 12th Grade
•
Practice Problem
•
Hard
Standards-aligned

Emma Peterson
FREE Resource
Standards-aligned
Read more
10 questions
Show all answers
1.
MULTIPLE CHOICE QUESTION
30 sec • 1 pt
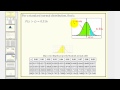
What is the probability that a randomly selected data value has a z-score greater than c?
0.048
0.5
0.316
0.684
Tags
CCSS.HSS.ID.A.4
2.
MULTIPLE CHOICE QUESTION
30 sec • 1 pt
In a standard normal distribution, what percentage of data lies below z = 0?
50%
75%
25%
100%
Tags
CCSS.HSS.ID.A.4
3.
MULTIPLE CHOICE QUESTION
30 sec • 1 pt
Why is the z-score positive when finding the probability that z is greater than c?
Because the area is exactly 0.5
Because the area is less than 0.5
Because the area is more than 0.5
Because the area is negative
Tags
CCSS.HSS.ID.A.4
4.
MULTIPLE CHOICE QUESTION
30 sec • 1 pt
What does the cumulative z-score table provide?
The total area under the curve
The area to the right of the z-score
The area to the left of the z-score
The exact z-score value
Tags
CCSS.HSS.ID.A.4
5.
MULTIPLE CHOICE QUESTION
30 sec • 1 pt
How do you find the left-side probability if the right-side probability is 0.316?
Divide 0.316 by 2
Multiply 0.316 by 2
Subtract 0.316 from 1
Add 0.316 to 1
Tags
CCSS.HSS.ID.A.4
6.
MULTIPLE CHOICE QUESTION
30 sec • 1 pt
What is the approximate z-score 'c' found using the cumulative z-score table?
0.48
0.316
0.684
0.048
Tags
CCSS.HSS.ID.A.4
7.
MULTIPLE CHOICE QUESTION
30 sec • 1 pt
What is the probability of z being less than the z-score 'c' found?
0.048
0.316
0.684
0.5
Tags
CCSS.HSS.ID.A.4
Access all questions and much more by creating a free account
Create resources
Host any resource
Get auto-graded reports
Continue with Google

Continue with Email
Continue with Classlink
Continue with Clever
or continue with
Microsoft
%20(1).png)
Apple
Others
Already have an account?
Popular Resources on Wayground

15 questions
Fractions on a Number Line
Quiz
•
3rd Grade
20 questions
Equivalent Fractions
Quiz
•
3rd Grade
25 questions
Multiplication Facts
Quiz
•
5th Grade
54 questions
Analyzing Line Graphs & Tables
Quiz
•
4th Grade
22 questions
fractions
Quiz
•
3rd Grade
20 questions
Main Idea and Details
Quiz
•
5th Grade
20 questions
Context Clues
Quiz
•
6th Grade
15 questions
Equivalent Fractions
Quiz
•
4th Grade
Discover more resources for Mathematics
18 questions
SAT Prep: Ratios, Proportions, & Percents
Quiz
•
9th - 10th Grade
12 questions
Parallel Lines Cut by a Transversal
Quiz
•
10th Grade
12 questions
Add and Subtract Polynomials
Quiz
•
9th - 12th Grade
10 questions
Elijah McCoy: Innovations and Impact in Black History
Interactive video
•
6th - 10th Grade
16 questions
Converting Improper Fractions to Mixed Numbers
Quiz
•
4th - 10th Grade
15 questions
Intro to Trig Ratios
Quiz
•
10th Grade
10 questions
Solving One Step Equations: Key Concepts and Techniques
Interactive video
•
6th - 10th Grade
12 questions
Triangle Inequality Theorem
Quiz
•
10th Grade