Writing and interpreting functions
Authored by Wayground Content
Mathematics
9th - 12th Grade
CCSS covered

AI Actions
Add similar questions
Adjust reading levels
Convert to real-world scenario
Translate activity
More...
Content View
Student View
20 questions
Show all answers
1.
MULTIPLE CHOICE QUESTION
30 sec • 1 pt
Iris founded a new town, Iristown. The population of Iristown after x years can be modeled by the function p(x) = 1500(1.1)x. On average, how fast is the population increasing between years 0 and 10?
212.12 people/year
251.11 people/year
239.06 people/year
391.29 people/year
Tags
CCSS.HSF.IF.B.4
2.
MULTIPLE CHOICE QUESTION
5 mins • 1 pt

The table shows the distance Tommy ran in different minutes. During which time interval did the salary increase at the greatest rate?
Tags
CCSS.HSF.IF.B.4
3.
MULTIPLE CHOICE QUESTION
1 min • 1 pt
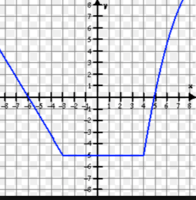
Over what interval is this function constant?
Tags
CCSS.HSF.IF.B.4
4.
MULTIPLE CHOICE QUESTION
30 sec • 1 pt
A variable that stays the same is called....
control
independent variable
dependent variable
responding variable
Tags
CCSS.HSF.IF.B.4
5.
MULTIPLE CHOICE QUESTION
30 sec • 1 pt

Over which interval of time is this person returning home?
A
B
C
D
E
Tags
CCSS.HSF.IF.B.4
6.
MULTIPLE CHOICE QUESTION
2 mins • 1 pt

The graph represents linear data. Which statement is incorrect?
The quantity depends on the price.
The price is the independent variable.
The price is a function of the quantity.
The larger the quantity, the higher the price.
Tags
CCSS.HSF.IF.B.4
7.
MULTIPLE CHOICE QUESTION
30 sec • 1 pt

What is the y intercept of the table?
7
2
9
5
Tags
CCSS.HSF.IF.B.4


Access all questions and much more by creating a free account
Create resources
Host any resource
Get auto-graded reports
Continue with Google

Continue with Email
Continue with Classlink
Continue with Clever
or continue with
Microsoft
%20(1).png)
Apple
Others
Already have an account?
Similar Resources on Wayground

20 questions
lecture fonction
Quiz
•
9th - 10th Grade
20 questions
G12_Math+for+Bus+Eco_Term+Exam_Mock+Test
Quiz
•
12th Grade
20 questions
Pythagorean Theorem Practice
Quiz
•
7th - 9th Grade
20 questions
เซต-1-2566
Quiz
•
10th Grade
20 questions
Ulangan Persaman Lingkaran
Quiz
•
11th Grade
15 questions
Polinômios
Quiz
•
8th - 12th Grade
15 questions
Rentenrechnung 3
Quiz
•
11th Grade - University
20 questions
Basic Math (M32102)
Quiz
•
10th - 11th Grade
Popular Resources on Wayground
15 questions
Fractions on a Number Line
Quiz
•
3rd Grade
20 questions
Equivalent Fractions
Quiz
•
3rd Grade
25 questions
Multiplication Facts
Quiz
•
5th Grade
54 questions
Analyzing Line Graphs & Tables
Quiz
•
4th Grade
22 questions
fractions
Quiz
•
3rd Grade
20 questions
Main Idea and Details
Quiz
•
5th Grade
20 questions
Context Clues
Quiz
•
6th Grade
15 questions
Equivalent Fractions
Quiz
•
4th Grade
Discover more resources for Mathematics
20 questions
Graphing Inequalities on a Number Line
Quiz
•
6th - 9th Grade
18 questions
SAT Prep: Ratios, Proportions, & Percents
Quiz
•
9th - 10th Grade
12 questions
Exponential Growth and Decay
Quiz
•
9th Grade
12 questions
Parallel Lines Cut by a Transversal
Quiz
•
10th Grade
12 questions
Add and Subtract Polynomials
Quiz
•
9th - 12th Grade
15 questions
Combine Like Terms and Distributive Property
Quiz
•
8th - 9th Grade
20 questions
Function or Not a Function
Quiz
•
8th - 9th Grade
10 questions
Elijah McCoy: Innovations and Impact in Black History
Interactive video
•
6th - 10th Grade