
Interpreting and Representing Data
Authored by Barbara White
Mathematics
4th - 5th Grade
CCSS covered
Used 5+ times


AI Actions
Add similar questions
Adjust reading levels
Convert to real-world scenario
Translate activity
More...
Content View
Student View
10 questions
Show all answers
1.
MULTIPLE CHOICE QUESTION
15 mins • 1 pt

How many more students prefer kangaroos and hippos than elephants?
1
3
8
11
2.
MULTIPLE CHOICE QUESTION
15 mins • 1 pt

What is the main purpose of a line graph?
to compare two things
to show change over time
to have an independent variable
so you don't have to read words
3.
MULTIPLE CHOICE QUESTION
15 mins • 1 pt
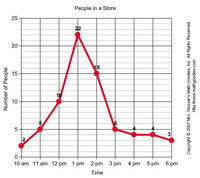
When was the greatest amount of shoppers at the store?
Tags
CCSS.5.G.A.2
4.
MULTIPLE CHOICE QUESTION
15 mins • 1 pt
What did you eat for supper last night?
Numerical
Categorical
Tags
CCSS.RI.4.7
CCSS.RI.5.7
CCSS.RI.6.7
CCSS.RL.4.7
CCSS.RL.5.7
5.
MULTIPLE CHOICE QUESTION
15 mins • 1 pt
How much time does it take to clean your room?
Categorical
Numerical
6.
MULTIPLE CHOICE QUESTION
15 mins • 1 pt
Represents objects or individuals by numbers assigned to certain measurable properties
Graphs
Numerical Data
5th grade
Categorical Data
7.
MULTIPLE CHOICE QUESTION
15 mins • 1 pt
Represent characteristics such as eye color, types of movies, or genres of books. It can be grouped into categories.
Numerical Data
Data
Categorical Data:
Questions that change
Access all questions and much more by creating a free account
Create resources
Host any resource
Get auto-graded reports

Continue with Google

Continue with Email

Continue with Microsoft
or continue with

%20(1).png)
Apple

Others
By signing up, you agree to our Terms of Service & Privacy Policy
Already have an account?

