Pie Charts Fractions With Model
Quiz
•
Mathematics
•
5th Grade
•
Hard
+1
Standards-aligned

Barbara White
FREE Resource
10 questions
Show all answers
1.
MULTIPLE CHOICE QUESTION
1 min • 1 pt

2.
MULTIPLE CHOICE QUESTION
30 sec • 1 pt

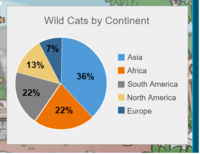
Which Continent is home to most wild cats?
Asia
Africa
North America
South America
3.
MULTIPLE CHOICE QUESTION
1 min • 1 pt

Tags
CCSS.6.RP.A.3C
4.
MULTIPLE CHOICE QUESTION
1 min • 1 pt
What percentage does a whole pie chart represent?
360%
90%
50%
100%
5.
MULTIPLE CHOICE QUESTION
1 min • 1 pt

6.
MULTIPLE CHOICE QUESTION
1 min • 1 pt

7.
MULTIPLE CHOICE QUESTION
30 sec • 1 pt

32 people went to a ice hockey match. The pie chart shows the colours of their shirts. How many people wore black?
45
1
4
Create a free account and access millions of resources
Similar Resources on Wayground

10 questions
Smart Charts
Quiz
•
4th - 5th Grade

10 questions
MATHS 5 UNIT 10 RQ
Quiz
•
5th Grade

10 questions
Line Plots
Quiz
•
5th Grade - University

15 questions
Data, Solids, Equations & Grouping
Quiz
•
5th Grade

15 questions
Data on a Line Plot
Quiz
•
5th Grade - University

10 questions
แผนภูมิวงกลม
Quiz
•
5th Grade

15 questions
Reading and Interpreting Pie Charts
Quiz
•
5th - 6th Grade

12 questions
P5 Pie Charts
Quiz
•
5th Grade
Popular Resources on Wayground

10 questions
Lab Safety Procedures and Guidelines
Interactive video
•
6th - 10th Grade

10 questions
Nouns, nouns, nouns
Quiz
•
3rd Grade

10 questions
9/11 Experience and Reflections
Interactive video
•
10th - 12th Grade

25 questions
Multiplication Facts
Quiz
•
5th Grade

11 questions
All about me
Quiz
•
Professional Development

22 questions
Adding Integers
Quiz
•
6th Grade

15 questions
Subtracting Integers
Quiz
•
7th Grade

9 questions
Tips & Tricks
Lesson
•
6th - 8th Grade
Discover more resources for Mathematics

25 questions
Multiplication Facts
Quiz
•
5th Grade

20 questions
Finding Volume of Rectangular Prisms
Quiz
•
5th Grade

15 questions
Order of Operations
Quiz
•
5th Grade

20 questions
Decimals Place Value to the Thousandths
Quiz
•
5th Grade

20 questions
Adding and Subtracting Decimals
Quiz
•
5th Grade

16 questions
Mean, Median, Mode, and Range
Quiz
•
5th Grade

20 questions
Place Value - Decimals
Quiz
•
5th Grade

10 questions
Adding and Subtracting Decimals
Quiz
•
5th Grade


