
Reading Graphs
Authored by Barbara White
Science
5th - 8th Grade
CCSS covered


AI Actions
Add similar questions
Adjust reading levels
Convert to real-world scenario
Translate activity
More...
Content View
Student View
22 questions
Show all answers
1.
MULTIPLE CHOICE QUESTION
15 mins • 1 pt

Look at the bar graph. Can you tell what the bar graph measures?
Kilowatts used by appliances per day
Average Hours appliances were used per day
Number of hours each appliance was used per day
Hours appliance used monthly
2.
MULTIPLE CHOICE QUESTION
1 min • 1 pt

Which appliance is used twice as many hours on the weekends as it is on weekdays?
3.
MULTIPLE CHOICE QUESTION
15 mins • 1 pt

The bar graph shows data about the pets owned by math students in four classes. One bar is missing from the graph. If the students have a total of 32 dogs, which bar shows the number of dogs Ms. Davalos's class has?


Tags
CCSS.2.MD.D.9
4.
MULTIPLE CHOICE QUESTION
5 mins • 1 pt

Which month had the greatest number of books read?
November
December
January
February
Tags
CCSS.5.G.A.2
5.
MULTIPLE CHOICE QUESTION
30 sec • 1 pt

The graph shows the number of inches a plant grew each week.
Between which 2 weeks did the plant grow the MOST?
Week 1 and Week 2
Week 2 and Week 3
Week 3 and Week 4
Week 4 and Week 5
Tags
CCSS.5.G.A.2
6.
MULTIPLE CHOICE QUESTION
2 mins • 1 pt

How many more miles did Jason drive on Wednesday than on Tuesday?
Tags
CCSS.4.OA.A.3
7.
MULTIPLE CHOICE QUESTION
1 min • 1 pt

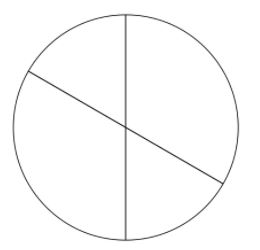
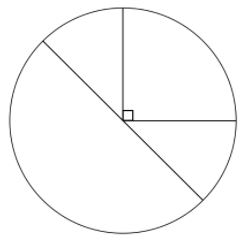
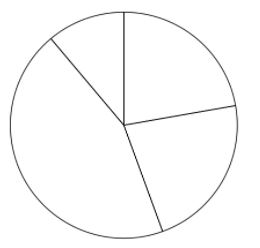
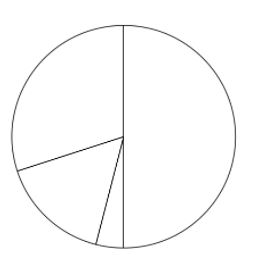
The pie chart shows the colours of 32 beads. How many green beads are there?
90
8
11
9
Tags
CCSS.2.MD.D.9

Access all questions and much more by creating a free account
Create resources
Host any resource
Get auto-graded reports

Continue with Google

Continue with Email

Continue with Microsoft
or continue with

%20(1).png)
Apple

Others
By signing up, you agree to our Terms of Service & Privacy Policy
Already have an account?


