Reading Linear Graphs
Authored by Barbara White
Mathematics
6th Grade
CCSS covered
Used 3+ times

AI Actions
Add similar questions
Adjust reading levels
Convert to real-world scenario
Translate activity
More...
Content View
Student View
10 questions
Show all answers
1.
MULTIPLE CHOICE QUESTION
5 mins • 1 pt

A restaurant recorded the number of pizzas sold each month for one year. The data are shown in the graph below. During which month did the restaurant sell 40 pizzas?
March
May
July
August
Tags
CCSS.HSN.VM.C.6
2.
MULTIPLE CHOICE QUESTION
5 mins • 1 pt

Which month had the biggest difference between the high and low temperatures?
January
April
October
November
Tags
CCSS.7.EE.B.3
3.
MULTIPLE CHOICE QUESTION
5 mins • 1 pt

What is the main purpose of a line graph?
4.
MULTIPLE CHOICE QUESTION
5 mins • 1 pt

What was the overall trend on this graph?
Tags
CCSS.HSF.IF.B.4
5.
MULTIPLE CHOICE QUESTION
5 mins • 1 pt

How many more miles did Jason drive on Wednesday than on Tuesday?
Tags
CCSS.3.OA.D.8
6.
MULTIPLE CHOICE QUESTION
5 mins • 1 pt
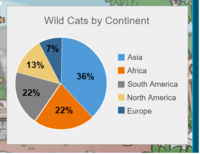
Which Continent has the smallest % of wild cats?
7.
MULTIPLE CHOICE QUESTION
5 mins • 1 pt

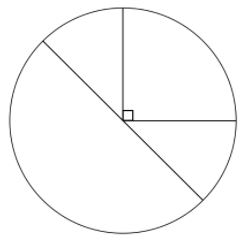
The pie chart shows the colours of 32 beads. How many green beads are there?
90
8
11
9
Access all questions and much more by creating a free account
Create resources
Host any resource
Get auto-graded reports

Continue with Google

Continue with Email

Continue with Classlink

Continue with Clever
or continue with

Microsoft
%20(1).png)
Apple
Others
Already have an account?
Similar Resources on Wayground

12 questions
Choosing suitable units
Quiz
•
6th Grade

10 questions
MATH QUIZ BEE FOR GRADE 6 (DIFFICULT ROUND)
Quiz
•
6th Grade

13 questions
PLACE VALUE 9 DIGITS
Quiz
•
6th Grade

12 questions
OpenUp 6th Math 1.18 Practice Problems and Vocab
Quiz
•
6th Grade

14 questions
Adding Subtracting Decimals (incl. capacity conversions)
Quiz
•
6th Grade

10 questions
P5 Tiny numbers
Quiz
•
5th - 6th Grade

10 questions
Decimals Mastery Quiz
Quiz
•
4th Grade - University

11 questions
KNOWING OUR NUMBERS
Quiz
•
6th - 7th Grade
Popular Resources on Wayground

15 questions
Fractions on a Number Line
Quiz
•
3rd Grade

20 questions
Equivalent Fractions
Quiz
•
3rd Grade

25 questions
Multiplication Facts
Quiz
•
5th Grade

22 questions
fractions
Quiz
•
3rd Grade

20 questions
Main Idea and Details
Quiz
•
5th Grade

20 questions
Context Clues
Quiz
•
6th Grade

15 questions
Equivalent Fractions
Quiz
•
4th Grade

20 questions
Figurative Language Review
Quiz
•
6th Grade
Discover more resources for Mathematics

20 questions
Exponents
Quiz
•
6th Grade

15 questions
Distributive Property & Review
Quiz
•
6th Grade

20 questions
Writing Algebraic Expressions
Quiz
•
6th Grade

20 questions
Ratios/Rates and Unit Rates
Quiz
•
6th Grade

20 questions
Writing and Graphing Inequalities
Quiz
•
6th Grade

10 questions
Unit Rate
Quiz
•
6th Grade

20 questions
Graphing Inequalities on a Number Line
Quiz
•
6th - 9th Grade

18 questions
Combining Like Terms
Quiz
•
6th Grade

