Linear and Non-Linear Equations
Authored by Anthony Clark
Mathematics
9th Grade
CCSS covered
Used 1+ times

AI Actions
Add similar questions
Adjust reading levels
Convert to real-world scenario
Translate activity
More...
Content View
Student View
15 questions
Show all answers
1.
MULTIPLE CHOICE QUESTION
1 min • 5 pts

Why is this function linear?
This is a linear function because it does not have a constant rate of change
This is a linear function because it creates a curved line.
This is a linear function because it have a constant rate of change.
This is a linear function because it's y-intercept is (0,2)
Tags
CCSS.HSF-LE.A.1B
2.
MULTIPLE CHOICE QUESTION
1 min • 5 pts

Is this function linear or nonlinear?
Linear function
Nonlinear function
Tags
CCSS.8.F.A.3
3.
MULTIPLE CHOICE QUESTION
1 min • 5 pts

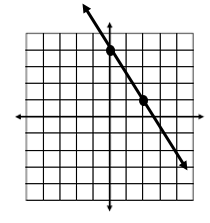
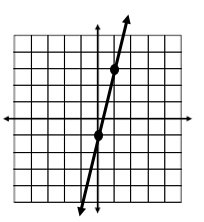
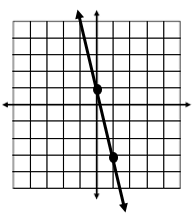
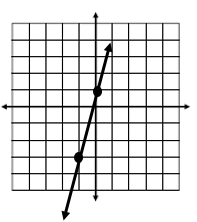
Which graph is linear?
Graph A
Graph B
Graph C
Graph D
Tags
CCSS.8.F.A.3
4.
MULTIPLE CHOICE QUESTION
1 min • 5 pts

Which graph(s) show nonlinear functions?
Graph I, only
Graph II, only
Graph I and Graph II, only.
Graph I, Graph II, and Graph III
Tags
CCSS.8.F.A.1
CCSS.HSF.IF.B.5
5.
MULTIPLE CHOICE QUESTION
1 min • 1 pt

Which equation matches the table?
y = 3x + 9
y = x + 9
y = x + 3
y = 12x - 3
Tags
CCSS.6.EE.C.9
6.
MULTIPLE CHOICE QUESTION
1 min • 1 pt

Which graph represents the table?


Tags
CCSS.8.EE.B.5
7.
MULTIPLE CHOICE QUESTION
1 min • 1 pt


Access all questions and much more by creating a free account
Create resources
Host any resource
Get auto-graded reports
Continue with Google

Continue with Email
Continue with Classlink
Continue with Clever
or continue with
Microsoft
%20(1).png)
Apple
Others
Already have an account?
Similar Resources on Wayground

20 questions
CAPS Grade 9 Algebraic Expressions Quiz
Quiz
•
8th - 9th Grade
14 questions
Habilidad Mental
Quiz
•
9th Grade
20 questions
Uji Kompetensi Matematika 2 kelas 9
Quiz
•
9th Grade
20 questions
MATEMATICAS 3º ESO BLOQUE 2 CRT 2 (PROGRESIONES)
Quiz
•
9th Grade
12 questions
Homework 3/18
Quiz
•
9th Grade
19 questions
Funciones lineales
Quiz
•
9th - 11th Grade
20 questions
Linear Relationships Review
Quiz
•
8th - 9th Grade
12 questions
SISTEMAS DE ECUACIONES 3º ESO
Quiz
•
9th Grade
Popular Resources on Wayground
15 questions
Fractions on a Number Line
Quiz
•
3rd Grade
20 questions
Equivalent Fractions
Quiz
•
3rd Grade
25 questions
Multiplication Facts
Quiz
•
5th Grade
54 questions
Analyzing Line Graphs & Tables
Quiz
•
4th Grade
22 questions
fractions
Quiz
•
3rd Grade
20 questions
Main Idea and Details
Quiz
•
5th Grade
20 questions
Context Clues
Quiz
•
6th Grade
15 questions
Equivalent Fractions
Quiz
•
4th Grade
Discover more resources for Mathematics
20 questions
Graphing Inequalities on a Number Line
Quiz
•
6th - 9th Grade
18 questions
SAT Prep: Ratios, Proportions, & Percents
Quiz
•
9th - 10th Grade
12 questions
Exponential Growth and Decay
Quiz
•
9th Grade
12 questions
Add and Subtract Polynomials
Quiz
•
9th - 12th Grade
15 questions
Combine Like Terms and Distributive Property
Quiz
•
8th - 9th Grade
20 questions
Function or Not a Function
Quiz
•
8th - 9th Grade
10 questions
Elijah McCoy: Innovations and Impact in Black History
Interactive video
•
6th - 10th Grade
16 questions
Converting Improper Fractions to Mixed Numbers
Quiz
•
4th - 10th Grade