Ratio Tables, Graphs, and Double Number Lines
Authored by Anthony Clark
Mathematics
6th Grade
CCSS covered
Used 5+ times

AI Actions
Add similar questions
Adjust reading levels
Convert to real-world scenario
Translate activity
More...
Content View
Student View
20 questions
Show all answers
1.
MULTIPLE CHOICE QUESTION
1 min • 1 pt

The ratio of red paint to yellow paint in a mixture is shown in the double number line above. How many teaspoons of yellow paint are in 4 batches?
20
4
12
15
2.
MULTIPLE CHOICE QUESTION
1 min • 1 pt

Refer to the double number line.
If Kim makes 8 loaves of bread, how many cups of raisins did she use?
4
12
16
24
3.
MULTIPLE CHOICE QUESTION
1 min • 1 pt

Optimus Prime is using a double number line to determine the amount of raisins he will use for a raisin bread recipe.
If he uses 9 cups of raisins, how many loaves will he make?
4
5
6
7
4.
MULTIPLE CHOICE QUESTION
1 min • 1 pt

Complete the ratio table
10, 35
12, 41
10, 41
10, 45
5.
MULTIPLE CHOICE QUESTION
1 min • 1 pt
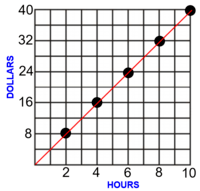
What is the ratio of the line graph shown?
4:1
2:1
3:2
8:1
6.
MULTIPLE CHOICE QUESTION
1 min • 1 pt

Which numbers come next on the double number line?
Sugar: 12
Flour: 8
Sugar: 12
Flour: 18
Sugar: 8
Flour: 12
I have no idea!
7.
MULTIPLE CHOICE QUESTION
1 min • 1 pt

Complete the ratio tables
10, 15, 20
15, 20, 25
10, 35, 45
10, 15, 30


Access all questions and much more by creating a free account
Create resources
Host any resource
Get auto-graded reports
Continue with Google

Continue with Email
Continue with Classlink
Continue with Clever
or continue with
Microsoft
%20(1).png)
Apple
Others
Already have an account?
