Pie Charts Representing Two Fractions
Quiz
•
Mathematics
•
8th Grade
•
Hard
+8
Standards-aligned

Anthony Clark
FREE Resource
18 questions
Show all answers
1.
MULTIPLE CHOICE QUESTION
1 min • 1 pt
What angle would you use to represent 40 red cars out of 90 cars in total on a pie chart?
40 degrees
160 degrees
4 degrees
90 degrees
2.
MULTIPLE CHOICE QUESTION
1 min • 1 pt

The under 13's played 28 matches.
The under 15's played 18 matches.
Which team won more matches?
Under 13's
Under 15's
Tags
CCSS.6.RP.A.3C
3.
MULTIPLE CHOICE QUESTION
1 min • 1 pt

The pie chart shows the colours of 32 beads. How many green beads are there?
90
8
11
9
Tags
CCSS.7.EE.B.3
4.
MULTIPLE CHOICE QUESTION
1 min • 1 pt

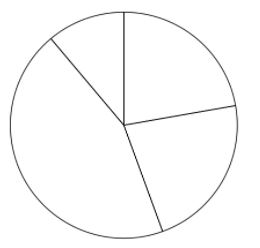
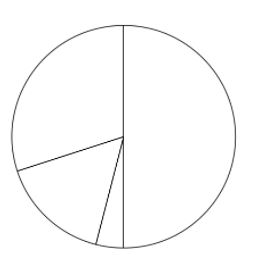
Which pie chart represents the same data as the table?


5.
MULTIPLE CHOICE QUESTION
1 min • 1 pt

This pie chart shows the colour of hats that Tim owns. What fraction of Tim's hats are blue?
impossible to say
Tags
CCSS.3.NF.A.1
CCSS.3.NF.A.2B
6.
MULTIPLE CHOICE QUESTION
1 min • 1 pt

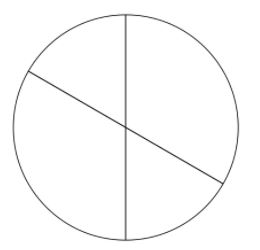
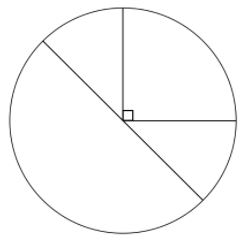
These pie charts show how people travel to work in 2 towns. In which town do more people travel to work by bike?
town A
town B
both the same
impossible to say
7.
MULTIPLE CHOICE QUESTION
1 min • 1 pt

This pie chart shows the colour of hats that Tom owns. Which colour hat does he own the second most of?
red
blue
green
yellow
Tags
CCSS.7.RP.A.2C
Create a free account and access millions of resources
Similar Resources on Wayground

20 questions
12 Data
Quiz
•
12th Grade

14 questions
Choosing Data Display
Quiz
•
9th Grade - University

13 questions
Statistics Graphs
Quiz
•
10th - 12th Grade

19 questions
Appropriate Data Display
Quiz
•
7th Grade - University

14 questions
Data and Statistics Illian
Quiz
•
7th Grade - University

20 questions
interpreting data and graphs w7
Quiz
•
7th - 9th Grade

19 questions
Different Types of Data
Quiz
•
7th Grade - University
Popular Resources on Wayground

10 questions
Lab Safety Procedures and Guidelines
Interactive video
•
6th - 10th Grade

10 questions
Nouns, nouns, nouns
Quiz
•
3rd Grade

10 questions
9/11 Experience and Reflections
Interactive video
•
10th - 12th Grade

25 questions
Multiplication Facts
Quiz
•
5th Grade

11 questions
All about me
Quiz
•
Professional Development

22 questions
Adding Integers
Quiz
•
6th Grade

15 questions
Subtracting Integers
Quiz
•
7th Grade

9 questions
Tips & Tricks
Lesson
•
6th - 8th Grade
Discover more resources for Mathematics

24 questions
3.1 Parallel lines cut by a transversal
Quiz
•
8th Grade

20 questions
Adding Integers
Quiz
•
6th - 8th Grade

10 questions
Rigid Transformations Grade 8 Unit 1 Lesson 7
Quiz
•
8th Grade

20 questions
Rational and Irrational Numbers
Quiz
•
8th Grade

15 questions
Solving Equations with Variables on Both Sides Review
Quiz
•
8th Grade

20 questions
Operations with integers
Quiz
•
8th Grade

15 questions
Solving Equations With Variables on Both Sides
Quiz
•
8th Grade

20 questions
Translations
Quiz
•
8th Grade


