Data Tables and Graphs
Authored by Anthony Clark
Mathematics
7th Grade
CCSS covered

AI Actions
Add similar questions
Adjust reading levels
Convert to real-world scenario
Translate activity
More...
Content View
Student View
19 questions
Show all answers
1.
MULTIPLE CHOICE QUESTION
1 min • 1 pt

What algebraic equation shows the relationship between the independent and dependent variables?
y = ax
y = x + 12
y = -3x
y =
Tags
CCSS.6.EE.C.9
2.
MULTIPLE CHOICE QUESTION
1 min • 1 pt

What is the unit rate in this proportional relationship?
60 miles/1 hour
120 miles/ 2 hours
1 mile/ 1 hour
Tags
CCSS.7.RP.A.2D
3.
MULTIPLE CHOICE QUESTION
1 min • 1 pt

What is the unit rate for the rain fall?
2 cm per hour
1 cm per hour
1/2 cm per hour
4 cm per hour
Tags
CCSS.7.RP.A.2D
4.
MULTIPLE CHOICE QUESTION
1 min • 1 pt

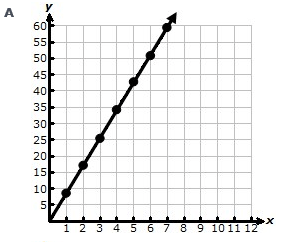
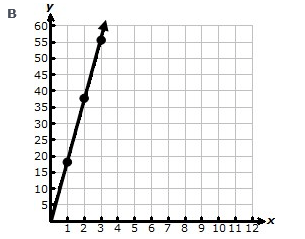
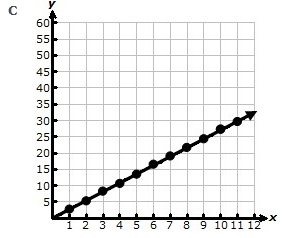
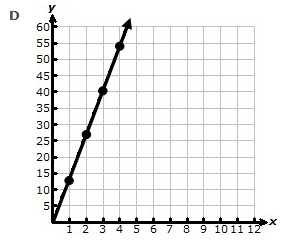
Which graph represents the data?


Tags
CCSS.8.EE.B.5
5.
MULTIPLE CHOICE QUESTION
1 min • 1 pt

Which graph represents the data and shows the unit rate?


Tags
CCSS.7.RP.A.2D
6.
MULTIPLE CHOICE QUESTION
1 min • 1 pt

Based on the graph, explain the unit rate.
The unit rate is 125
The unit rate is 1
Not here
Tags
CCSS.7.RP.A.2D
7.
MULTIPLE CHOICE QUESTION
1 min • 1 pt
Carter receives $13.50 for every 5 boxes of chocolate he sells. Which graph shows this relationship?
Tags
CCSS.8.EE.B.5


Access all questions and much more by creating a free account
Create resources
Host any resource
Get auto-graded reports
Continue with Google

Continue with Email
Continue with Classlink
Continue with Clever
or continue with
Microsoft
%20(1).png)
Apple
Others
Already have an account?
Similar Resources on Wayground

20 questions
Central Limit Theorem for Sums
Quiz
•
11th - 12th Grade
15 questions
IMAGINACION ESPACIAL N*2
Quiz
•
University
14 questions
Alg. CH 5 Terms
Quiz
•
9th Grade
20 questions
Arithmetic and Geometric Sequence Practice
Quiz
•
8th - 9th Grade
16 questions
EM Graphs of Power Function
Quiz
•
7th Grade
20 questions
numeri relativi moltiplicazione
Quiz
•
7th Grade
20 questions
Vectors
Quiz
•
10th Grade
22 questions
Similar Polygons Review
Quiz
•
6th - 7th Grade
Popular Resources on Wayground
15 questions
Fractions on a Number Line
Quiz
•
3rd Grade
20 questions
Equivalent Fractions
Quiz
•
3rd Grade
25 questions
Multiplication Facts
Quiz
•
5th Grade
54 questions
Analyzing Line Graphs & Tables
Quiz
•
4th Grade
22 questions
fractions
Quiz
•
3rd Grade
20 questions
Main Idea and Details
Quiz
•
5th Grade
20 questions
Context Clues
Quiz
•
6th Grade
15 questions
Equivalent Fractions
Quiz
•
4th Grade
Discover more resources for Mathematics
22 questions
distributive property
Quiz
•
7th Grade
18 questions
Angle Relationships
Quiz
•
7th Grade
20 questions
How Some Friendships Last — and Others Don’t Video Questions
Quiz
•
7th Grade
18 questions
Handbook Refresher Quiz
Quiz
•
7th Grade
20 questions
Graphing Inequalities on a Number Line
Quiz
•
6th - 9th Grade
20 questions
graphing inequalities
Quiz
•
6th - 7th Grade
16 questions
Adding and Subtracting Integers
Quiz
•
7th Grade
20 questions
Angles: Complementary/Supplementary/ Vertical/ Adjacent
Quiz
•
7th Grade