Bivariate Statistics
Authored by Anthony Clark
Mathematics
9th Grade
CCSS covered

AI Actions
Add similar questions
Adjust reading levels
Convert to real-world scenario
Translate activity
More...
Content View
Student View
13 questions
Show all answers
1.
MULTIPLE CHOICE QUESTION
1 min • 1 pt

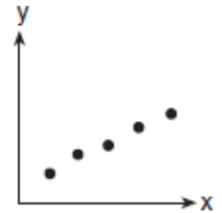
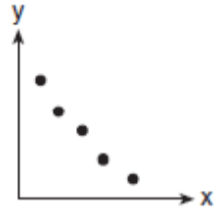
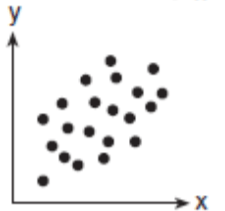
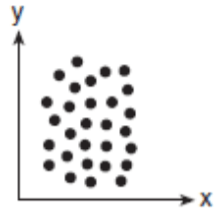
What type of association does this graph have?
positive
negative
none
all of the above
2.
MULTIPLE CHOICE QUESTION
1 min • 1 pt
Which scatter plot diagram shows the strongest negative correlation?


3.
MULTIPLE CHOICE QUESTION
1 min • 1 pt
-3
-13
-9
-20
4.
MULTIPLE CHOICE QUESTION
1 min • 1 pt
-5.17
18.45
1.59
-11.21
Tags
CCSS.8.EE.C.8C
5.
MULTIPLE CHOICE QUESTION
1 min • 1 pt
28.5
-21.5
-14
4.5
Tags
CCSS.8.EE.C.8C
6.
MULTIPLE CHOICE QUESTION
1 min • 1 pt

What percent of people like snowmobiles and skateboards?
62%
55%
43%
50%
7.
MULTIPLE CHOICE QUESTION
1 min • 1 pt
Describe a correlation with a coefficient of r=0.3
Strong positive
Weak positive
Strong negative
Weak negative
Access all questions and much more by creating a free account
Create resources
Host any resource
Get auto-graded reports

Continue with Google

Continue with Email

Continue with Classlink

Continue with Clever
or continue with

Microsoft
%20(1).png)
Apple
Others
Already have an account?
Similar Resources on Wayground

15 questions
Quiz on module-03
Quiz
•
University

10 questions
Ch 1 Introduction (Statistics)Class 11 Economics
Quiz
•
11th - 12th Grade

10 questions
Circle
Quiz
•
11th Grade

13 questions
Unit 8 Test Corrections
Quiz
•
9th Grade

10 questions
Chapter 3 Test Review (Big Ideas)
Quiz
•
9th Grade

10 questions
7.2 The Cosine Law
Quiz
•
12th Grade

10 questions
Find derivative and gradient of a tangent
Quiz
•
12th Grade

10 questions
QUIZ 1 - MAT1043
Quiz
•
University
Popular Resources on Wayground

15 questions
Fractions on a Number Line
Quiz
•
3rd Grade

20 questions
Equivalent Fractions
Quiz
•
3rd Grade

25 questions
Multiplication Facts
Quiz
•
5th Grade

54 questions
Analyzing Line Graphs & Tables
Quiz
•
4th Grade

22 questions
fractions
Quiz
•
3rd Grade

20 questions
Main Idea and Details
Quiz
•
5th Grade

20 questions
Context Clues
Quiz
•
6th Grade

15 questions
Equivalent Fractions
Quiz
•
4th Grade
Discover more resources for Mathematics

20 questions
Graphing Inequalities on a Number Line
Quiz
•
6th - 9th Grade

18 questions
SAT Prep: Ratios, Proportions, & Percents
Quiz
•
9th - 10th Grade

12 questions
Exponential Growth and Decay
Quiz
•
9th Grade

12 questions
Add and Subtract Polynomials
Quiz
•
9th - 12th Grade

15 questions
Combine Like Terms and Distributive Property
Quiz
•
8th - 9th Grade

20 questions
Function or Not a Function
Quiz
•
8th - 9th Grade

10 questions
Elijah McCoy: Innovations and Impact in Black History
Interactive video
•
6th - 10th Grade

16 questions
Converting Improper Fractions to Mixed Numbers
Quiz
•
4th - 10th Grade
