Graphical Data
Authored by Anthony Clark
Mathematics
12th Grade
CCSS covered
Used 4+ times

AI Actions
Add similar questions
Adjust reading levels
Convert to real-world scenario
Translate activity
More...
Content View
Student View
15 questions
Show all answers
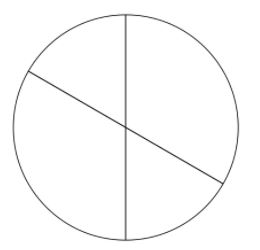
1.
MULTIPLE CHOICE QUESTION
1 min • 5 pts

which graph is this?
stem and leaf
dot plot
partero chart
pie chart
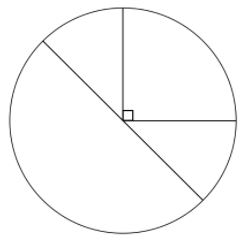
2.
MULTIPLE CHOICE QUESTION
1 min • 5 pts

which graph is this?
scatter plot
time chart
dot plot
splash plot
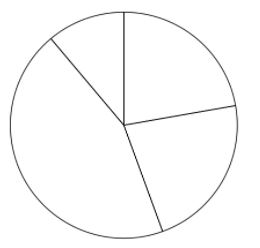
3.
MULTIPLE CHOICE QUESTION
1 min • 5 pts

which graph is this?
time chart
scatter plot
time series chart
pie chart
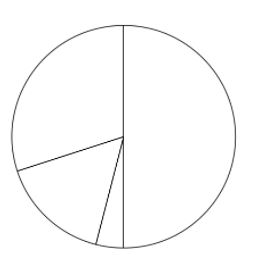
4.
MULTIPLE CHOICE QUESTION
1 min • 5 pts

which graph is this?
box graph
dot plot
parrot chart
pareto chart
5.
MULTIPLE CHOICE QUESTION
1 min • 1 pt

What is incorrect about the following histogram?
The intervals are too small
The intervals overlap
The graph does not start at 0
The axes are not labeled.
6.
MULTIPLE CHOICE QUESTION
1 min • 1 pt

Describe the histogram:
Left Skewed
Normal or Bell-Shaped
Right Skewed
Uniform or Flat
7.
MULTIPLE CHOICE QUESTION
1 min • 1 pt
Which graph represents histogram?


Access all questions and much more by creating a free account
Create resources
Host any resource
Get auto-graded reports

Continue with Google

Continue with Email

Continue with Classlink

Continue with Clever
or continue with

Microsoft
%20(1).png)
Apple
Others
Already have an account?
Similar Resources on Wayground

20 questions
Research Methodology Test
Quiz
•
University

10 questions
Z-transform
Quiz
•
University

10 questions
Quiz 1
Quiz
•
University

15 questions
Uji Kemampuan Bahasa Indonesia Kelas 4
Quiz
•
4th Grade - University

10 questions
BASIC PROBABILITY
Quiz
•
University

10 questions
UKURAN PEMUSATAN LETAK PENYEBARAN DATA TUNGGAL
Quiz
•
10th - 12th Grade

10 questions
Quiz 4 on sets
Quiz
•
9th Grade - University

10 questions
CLASS-IX MATHS
Quiz
•
9th - 12th Grade
Popular Resources on Wayground

15 questions
Fractions on a Number Line
Quiz
•
3rd Grade

20 questions
Equivalent Fractions
Quiz
•
3rd Grade

25 questions
Multiplication Facts
Quiz
•
5th Grade

22 questions
fractions
Quiz
•
3rd Grade

20 questions
Main Idea and Details
Quiz
•
5th Grade

20 questions
Context Clues
Quiz
•
6th Grade

15 questions
Equivalent Fractions
Quiz
•
4th Grade

20 questions
Figurative Language Review
Quiz
•
6th Grade
Discover more resources for Mathematics

12 questions
Add and Subtract Polynomials
Quiz
•
9th - 12th Grade

13 questions
Model Exponential Growth and Decay Scenarios
Quiz
•
9th - 12th Grade

27 questions
7.2.3 Quadrilateral Properties
Quiz
•
9th - 12th Grade

10 questions
Key Features of Quadratic Functions
Interactive video
•
8th - 12th Grade

11 questions
Exponent Quotient Rules A1 U7
Quiz
•
9th - 12th Grade

18 questions
Integer Operations
Quiz
•
5th - 12th Grade

15 questions
Exponential Growth and Decay Word Problems
Quiz
•
9th - 12th Grade

10 questions
complementary and Supplementary angles
Quiz
•
9th - 12th Grade


