Comparing Rates with Graphs
Authored by Anthony Clark
Mathematics
6th Grade
CCSS covered

AI Actions
Add similar questions
Adjust reading levels
Convert to real-world scenario
Translate activity
More...
Content View
Student View
20 questions
Show all answers
1.
MULTIPLE CHOICE QUESTION
1 min • 1 pt

If Victor based his decision on gas efficiency, which car should he buy?
The Legend
The Supreme
Neither
They are both equal
Tags
CCSS.6.RP.A.3A
2.
MULTIPLE CHOICE QUESTION
1 min • 1 pt

After comparing the two vehicles in the picture, Victor saw an advertisement for a third vehicle,the Lunar. The manager said the Lunar can travel 289 miles on a tank of gas. If the tank can hold 17 gallons of gas, what is the rate of miles per gallons of gas for the Lunar?
18 miles/gallon
16 miles/gallon
17 miles/gallon
289 miles/gallon
Tags
CCSS.6.RP.A.3B
3.
MULTIPLE CHOICE QUESTION
1 min • 1 pt

After comparing the two vehicles in the picture, Victor saw an advertisement for a third vehicle,the Lunar. The manager said the Lunar can travel 289 miles on a tank of gas. If the tank can hold 17 gallons of gas, which of the three vehicles is Victor's best option?
The Legend
The Supreme
The Lunar
They are all equal
Tags
CCSS.6.RP.A.3B
4.
MULTIPLE CHOICE QUESTION
1 min • 1 pt

Who won the argument?
Kiara
Giovanni
Ebony
They all had the same rate
Tags
CCSS.8.EE.B.5
5.
MULTIPLE CHOICE QUESTION
1 min • 1 pt

Which statement below accurately represents the graph?
$100 is earned for each hour worked
$200 earned for every 2 hours worked
is the unit rate
$500 is earned for every 8 hours worked
$300 is earned after working 4 hours
Tags
CCSS.7.RP.A.2D
6.
MULTIPLE CHOICE QUESTION
1 min • 1 pt

Which of the following statements can be used to create the graph shown?
For every 5 hours of work you get $6
For every 24 hours of work you get $10
For every 36 hours of work you get $50
For every 6 hours of work you get $5
Tags
CCSS.8.EE.B.5
7.
MULTIPLE CHOICE QUESTION
1 min • 1 pt
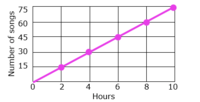
Based on the graph, how many songs would there be in 12 hours?
80 songs
15 songs
90 songs
65 songs
Tags
CCSS.HSF.LE.B.5


Access all questions and much more by creating a free account
Create resources
Host any resource
Get auto-graded reports
Continue with Google

Continue with Email
Continue with Microsoft
or continue with

%20(1).png)
Apple
Others
Already have an account?
