
Frequency Distribution Tables
Authored by Anthony Clark
Mathematics
10th Grade
CCSS covered


AI Actions
Add similar questions
Adjust reading levels
Convert to real-world scenario
Translate activity
More...
Content View
Student View
18 questions
Show all answers
1.
FILL IN THE BLANKS QUESTION
1 min • 1 pt
Two way tables show us the (a) or number of times something occurs.
2.
MULTIPLE CHOICE QUESTION
1 min • 1 pt

True or false:
Both 8th and 9th grade participants preferred winter the least.
true
false
3.
MULTIPLE CHOICE QUESTION
1 min • 1 pt
True or false:
The most popular season among 8th graders was summer.
true
false
4.
MULTIPLE CHOICE QUESTION
1 min • 1 pt
True or false:
There was an equal number of 8th and 9th graders surveyed.
true
false
5.
MULTIPLE CHOICE QUESTION
1 min • 1 pt
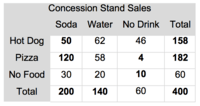
How many people purchased no food and no drink?
60
10
20
200
6.
MULTIPLE CHOICE QUESTION
1 min • 1 pt

Which of the following is a true statement?
A total of 348 6th grade students ordered in the cafeteria.
Of the students in the 8th grade, 128 ordered pizza.
A total of 333 students ordered a pizza.
Of the students in the 6th grade, 333 ordered pizza.
Tags
CCSS.HSN.VM.C.6
7.
MULTIPLE CHOICE QUESTION
1 min • 1 pt

Which of the following ratios could be used to find the relative frequency of 8th grade students?
127218\frac{127}{218}
218681\frac{218}{681}
127348\frac{127}{348}
260681\frac{260}{681}


Access all questions and much more by creating a free account
Create resources
Host any resource
Get auto-graded reports

Continue with Google

Continue with Email

Continue with Microsoft
or continue with

%20(1).png)
Apple

Others
By signing up, you agree to our Terms of Service & Privacy Policy
Already have an account?

