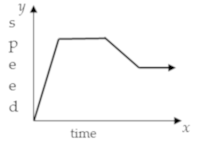
Interpreting Linear Functions Graphically
Authored by Anthony Clark
Mathematics
9th Grade
CCSS covered

AI Actions
Add similar questions
Adjust reading levels
Convert to real-world scenario
Translate activity
More...
Content View
Student View
10 questions
Show all answers
1.
MULTIPLE CHOICE QUESTION
1 min • 1 pt
The population of the town is given by the function y = 60,000 - 500x, where y is the number of inhabitants and x is the time in years. What is the population of the town after 9 years?
55,500
55,000
54,500
D:54,000
2.
MULTIPLE CHOICE QUESTION
1 min • 1 pt
The change in temperature is given by the function y = 68 - x, where y is the temperature in Fahrenheit degrees and x is the time in hours. What is the temperature after 2 hours?
70
69
67
66
Tags
CCSS.HSF.IF.A.2
3.
MULTIPLE CHOICE QUESTION
1 min • 1 pt
The profit of a company is given by the function y = 100,000 - 2,000x, where y is the profit in dollars and x is the time in months. What is the profit of a company after 5 months?
$98,000
$90,000
$89,000
$80,000
Tags
CCSS.HSF.LE.B.5
4.
MULTIPLE CHOICE QUESTION
1 min • 1 pt

According to the graph, at what speed is this car traveling in miles per hour?
80 mph
20 mph
40 mph
160 mph
Tags
CCSS.HSF.IF.B.4
5.
MULTIPLE CHOICE QUESTION
1 min • 1 pt
Tim bought a new phone. He paid $125 on the day of purchase, then $50 per month until it was paid off. What linear equation models this situation?
y = 50x - 135
y = 50x + 125
y = 125 + 50
y = 50x
Tags
CCSS.8.F.B.4
CCSS.HSF.LE.A.2
6.
MULTIPLE CHOICE QUESTION
1 min • 1 pt

What is the rate of change demonstrated in this graph?
2 cm per hour
1/4 cm per hour
1/2 cm per hour
4 cm per hour
Tags
CCSS.8.F.B.4
CCSS.HSF.IF.B.6
7.
MULTIPLE CHOICE QUESTION
1 min • 1 pt

What does the rate of change represent in this situation?
The sloth runs 1 feet in 3 minutes
The sloth runs 3 feet in 1 minute
The sloth runs fast
The sloth runs 6 feet in 1 minute
Tags
CCSS.HSF.IF.B.4
Access all questions and much more by creating a free account
Create resources
Host any resource
Get auto-graded reports

Continue with Google

Continue with Email

Continue with Classlink

Continue with Clever
or continue with

Microsoft
%20(1).png)
Apple
Others
Already have an account?
Similar Resources on Wayground

10 questions
Pre-Quiz Cal1
Quiz
•
University

11 questions
Algebra: Solving Linear Equations
Quiz
•
University

9 questions
เลขยกกำลัง
Quiz
•
11th Grade

10 questions
SPLTV
Quiz
•
10th Grade

11 questions
Super easy quiz
Quiz
•
9th - 12th Grade

15 questions
N-tá mocnina deseti
Quiz
•
8th - 9th Grade

10 questions
Rational Function
Quiz
•
11th Grade

11 questions
Moments and Moment Generating Function
Quiz
•
University
Popular Resources on Wayground

15 questions
Fractions on a Number Line
Quiz
•
3rd Grade

20 questions
Equivalent Fractions
Quiz
•
3rd Grade

25 questions
Multiplication Facts
Quiz
•
5th Grade

22 questions
fractions
Quiz
•
3rd Grade

20 questions
Main Idea and Details
Quiz
•
5th Grade

20 questions
Context Clues
Quiz
•
6th Grade

15 questions
Equivalent Fractions
Quiz
•
4th Grade

20 questions
Figurative Language Review
Quiz
•
6th Grade
Discover more resources for Mathematics

20 questions
Graphing Inequalities on a Number Line
Quiz
•
6th - 9th Grade

12 questions
Exponential Growth and Decay
Quiz
•
9th Grade

20 questions
Exponent Rules Review
Quiz
•
8th - 9th Grade

25 questions
Complementary and Supplementary Angles
Quiz
•
7th - 10th Grade

12 questions
Add and Subtract Polynomials
Quiz
•
9th - 12th Grade

13 questions
Model Exponential Growth and Decay Scenarios
Quiz
•
9th - 12th Grade

15 questions
Combine Like Terms and Distributive Property
Quiz
•
8th - 9th Grade

27 questions
7.2.3 Quadrilateral Properties
Quiz
•
9th - 12th Grade


