Evaluate Piecewise Functions and Graph Algebra
Authored by Anthony Clark
Mathematics
11th Grade
CCSS covered

AI Actions
Add similar questions
Adjust reading levels
Convert to real-world scenario
Translate activity
More...
Content View
Student View
10 questions
Show all answers
1.
MULTIPLE CHOICE QUESTION
1 min • 1 pt

Select the graph for 5x+ y ≤ -1 .
A
B
C
D
Tags
CCSS.HSA.REI.D.12
2.
MULTIPLE CHOICE QUESTION
1 min • 1 pt

Select the correct graph for each inequality. y≤ -¾x -1
A
B
C
D
Tags
CCSS.HSA.REI.D.12
3.
MULTIPLE CHOICE QUESTION
1 min • 1 pt

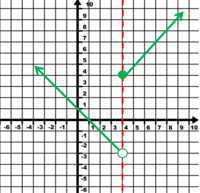
Evaluate the above piecewise function at x = -4 and x = 4


Tags
CCSS.HSF.IF.A.2
4.
MULTIPLE CHOICE QUESTION
1 min • 1 pt

Write a Piecewise Function that represents the above graph:


Tags
CCSS.HSF-IF.C.7B
5.
MULTIPLE CHOICE QUESTION
1 min • 1 pt

Graph the above piecewise function


Tags
CCSS.HSF-IF.C.7B
6.
MULTIPLE CHOICE QUESTION
1 min • 1 pt
There is a drip coming from the ceiling. Daniel puts a bucket under it to catch the water. The water drips for a period of 18 hours. The drip drops water at rate of 3 ounce per hour for the first 6 hours, at a rate of 2 ounces per hour for the next 10 hours, and at a rate of 1 ounces per hour over the last 2 hours. Write a piecewise function and sketch the graph that matches the accumulation.


Tags
CCSS.HSF-IF.C.7B
7.
MULTIPLE CHOICE QUESTION
1 min • 1 pt

Graph:


Access all questions and much more by creating a free account
Create resources
Host any resource
Get auto-graded reports
Continue with Google

Continue with Email
Continue with Classlink
Continue with Clever
or continue with
Microsoft
%20(1).png)
Apple
Others
Already have an account?
Similar Resources on Wayground

10 questions
Asesmen Awal
Quiz
•
11th Grade
10 questions
Tree and Planar Graph
Quiz
•
University
10 questions
EXAMEN DIAGNOSTICO MATEMATICAS 3
Quiz
•
11th Grade
15 questions
Equivalent Fraction
Quiz
•
5th Grade - University
10 questions
Vectores
Quiz
•
12th Grade
13 questions
ULANGAN HARIAN SEMESTER 1 MATEMATIKA PEMINATAN X MIPA
Quiz
•
12th Grade
10 questions
Limit Tak hingga 1
Quiz
•
12th Grade - University
15 questions
Year 10 Solving Equations
Quiz
•
9th - 11th Grade
Popular Resources on Wayground
7 questions
History of Valentine's Day
Interactive video
•
4th Grade
15 questions
Fractions on a Number Line
Quiz
•
3rd Grade
20 questions
Equivalent Fractions
Quiz
•
3rd Grade
25 questions
Multiplication Facts
Quiz
•
5th Grade
22 questions
fractions
Quiz
•
3rd Grade
15 questions
Valentine's Day Trivia
Quiz
•
3rd Grade
20 questions
Main Idea and Details
Quiz
•
5th Grade
20 questions
Context Clues
Quiz
•
6th Grade
Discover more resources for Mathematics
10 questions
Factor Quadratic Expressions with Various Coefficients
Quiz
•
9th - 12th Grade
10 questions
Evaluating Piecewise Functions Practice
Quiz
•
11th Grade
5 questions
Triangle Congruence Theorems
Interactive video
•
9th - 12th Grade
15 questions
Exponential Growth and Decay Word Problems Practice
Quiz
•
9th - 12th Grade
21 questions
Converting between Logs and Exponents
Quiz
•
11th Grade
20 questions
Classifying polynomials
Quiz
•
11th Grade
20 questions
special right triangles
Quiz
•
9th - 12th Grade
20 questions
Interpreting Scatter Plots
Quiz
•
8th - 12th Grade