Scatterplot Correlation Coefficients and Line of Best Fit
Quiz
•
Mathematics
•
9th Grade
•
Practice Problem
•
Hard
Standards-aligned

Anthony Clark
FREE Resource
Enhance your content in a minute
15 questions
Show all answers
1.
MULTIPLE CHOICE QUESTION
1 min • 1 pt
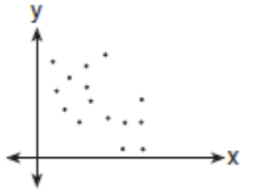
strong positive
strong negative
weak positive
weak negative
2.
MULTIPLE CHOICE QUESTION
1 min • 1 pt
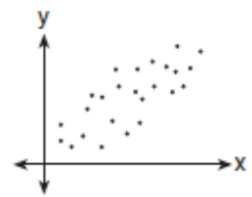
strong positive
strong negative
weak positive
weak negative
3.
MULTIPLE CHOICE QUESTION
1 min • 1 pt

A pizza restaurant's prices are shown in the table. Determine the line of best fit for the data represented in the table.
4.
MULTIPLE CHOICE QUESTION
1 min • 1 pt


5.
MULTIPLE CHOICE QUESTION
1 min • 1 pt

Determine the line of best fit for the data represented in the table.
6.
MULTIPLE CHOICE QUESTION
1 min • 1 pt

The table shows the height of a tree for various years after it was planted. Determine the line of best fit (''prediction equation"), then calculate how tall the tree would be 30 years after it was planted.
22 feet
23 feet
36 feet
37 feet
Tags
CCSS.HSF-LE.A.1B
7.
MULTIPLE CHOICE QUESTION
1 min • 1 pt

A ski resort records the weekly number of skiers and inches of snow as shown in the table. Create a line of best fit to predict how many skiers they could expect if they get 6 inches of snow.
(Hint: Use the graphing calculator to help you write your line of best fit, the prediction equation)
12 skiers
115 skiers
220 skiers
100 skiers
Access all questions and much more by creating a free account
Create resources
Host any resource
Get auto-graded reports

Continue with Google

Continue with Email

Continue with Classlink

Continue with Clever
or continue with

Microsoft
%20(1).png)
Apple
Others
Already have an account?
Similar Resources on Wayground

10 questions
Tree and Planar Graph
Quiz
•
University

20 questions
Bangun ruang sisi lengkung
Quiz
•
9th Grade

15 questions
Equivalent Fraction
Quiz
•
5th Grade - University

15 questions
Year 10 Solving Equations
Quiz
•
9th - 11th Grade

16 questions
Area of right angled and non right angled triangles
Quiz
•
10th Grade

10 questions
Arithematic progressions
Quiz
•
10th Grade

12 questions
Vlastnosti funkcií
Quiz
•
9th Grade

20 questions
1G Multiplication & Division (Negatives)
Quiz
•
8th - 10th Grade
Popular Resources on Wayground

15 questions
Fractions on a Number Line
Quiz
•
3rd Grade

20 questions
Equivalent Fractions
Quiz
•
3rd Grade

25 questions
Multiplication Facts
Quiz
•
5th Grade

22 questions
fractions
Quiz
•
3rd Grade

20 questions
Main Idea and Details
Quiz
•
5th Grade

20 questions
Context Clues
Quiz
•
6th Grade

15 questions
Equivalent Fractions
Quiz
•
4th Grade

20 questions
Figurative Language Review
Quiz
•
6th Grade
Discover more resources for Mathematics

20 questions
Graphing Inequalities on a Number Line
Quiz
•
6th - 9th Grade

12 questions
Exponential Growth and Decay
Quiz
•
9th Grade

20 questions
Exponent Rules Review
Quiz
•
8th - 9th Grade

25 questions
Complementary and Supplementary Angles
Quiz
•
7th - 10th Grade

12 questions
Add and Subtract Polynomials
Quiz
•
9th - 12th Grade

13 questions
Model Exponential Growth and Decay Scenarios
Quiz
•
9th - 12th Grade

15 questions
Combine Like Terms and Distributive Property
Quiz
•
8th - 9th Grade

27 questions
7.2.3 Quadrilateral Properties
Quiz
•
9th - 12th Grade


