
Ratio Graph Table
6th Grade
•20 Qs

Similar activities
Arithmetic Progression
10th Grade
•15 Qs
Pertukaran unit
5th - 6th Grade
•20 Qs
Kenguru 2016
7th - 10th Grade
•20 Qs
Soal latihan kelas 12
9th - 12th Grade
•20 Qs
9C BANGUN RUANG SISI LENGKUNG
9th Grade - University
•15 Qs
Paper 1 Mathematics PT3
8th - 10th Grade
•20 Qs
ESTADÍSTICA: Variables, Tabla de frecuencias
5th - 6th Grade
•20 Qs
Números enteros
12th Grade
•15 Qs

Ratio Graph Table
Quiz
•
Mathematics
•
6th Grade
•
Practice Problem
•
Hard
+3
Standards-aligned

Anthony Clark
FREE Resource
Enhance your content in a minute
20 questions
Show all answers
1.
MULTIPLE CHOICE QUESTION
1 min • 1 pt

The graph shows the cost of buying paint in 1-gallon buckets. Based on the graph, which dollar amount represents the cost to buy five 1-gallon buckets of paint?
$120
$125
$130
$135
Tags
CCSS.7.RP.A.2D
2.
MULTIPLE CHOICE QUESTION
1 min • 1 pt

What is the missing number in the ratio table?
72
85
76
90
3.
MULTIPLE CHOICE QUESTION
1 min • 1 pt

Is this table proportional?
Yes
No
Tags
CCSS.7.RP.A.2A
4.
MULTIPLE CHOICE QUESTION
1 min • 1 pt

A booth at the State Fair recorded the number of items sold in the chart. What is the ratio of lemonade and sodas sold to the number of candy bars sold?
7:6
6:7
4:3
3:7
Tags
CCSS.6.RP.A.1
CCSS.6.RP.A.2
5.
MULTIPLE CHOICE QUESTION
1 min • 1 pt

14 and 27
14 and 24
14 and 21
14 and 32
6.
MULTIPLE CHOICE QUESTION
1 min • 1 pt

Solve for C in the table.
C= 40
C= 10
C= 9
C= 45
Tags
CCSS.5.OA.B.3
7.
MULTIPLE CHOICE QUESTION
1 min • 1 pt

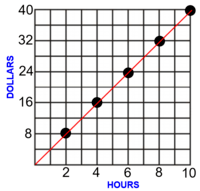
Does this graph represent a proportional relationship?
No, because it doesn't pass through the origin.
Yes, because it doesn't pass through the origin.
Yes, because it intersects the y axis.
No, because it intersects the x axis.
Tags
CCSS.7.RP.A.2D


Access all questions and much more by creating a free account
Create resources
Host any resource
Get auto-graded reports
Continue with Google

Continue with Email
Continue with Classlink
Continue with Clever
or continue with
Microsoft
%20(1).png)
Apple
Others
Already have an account?
Similar Resources on Wayground
15 questions
19.12 Hoạt động 1 Thống kê
Quiz
•
10th Grade
15 questions
KUIS STATISTIKA AWAL BAG.2
Quiz
•
12th Grade
15 questions
Radicales 3º ESO
Quiz
•
9th Grade
20 questions
EXTRA MATH # 2
Quiz
•
5th - 6th Grade
15 questions
Final ค33101 part2
Quiz
•
6th Grade
16 questions
Ch1: Measurement, Estimating
Quiz
•
University
16 questions
Fracciones
Quiz
•
6th Grade
19 questions
untitled
Quiz
•
7th Grade - University
Popular Resources on Wayground
15 questions
Fractions on a Number Line
Quiz
•
3rd Grade
20 questions
Equivalent Fractions
Quiz
•
3rd Grade
25 questions
Multiplication Facts
Quiz
•
5th Grade
22 questions
fractions
Quiz
•
3rd Grade
20 questions
Main Idea and Details
Quiz
•
5th Grade
20 questions
Context Clues
Quiz
•
6th Grade
15 questions
Equivalent Fractions
Quiz
•
4th Grade
20 questions
Figurative Language Review
Quiz
•
6th Grade
Discover more resources for Mathematics
20 questions
Exponents
Quiz
•
6th Grade
15 questions
Distributive Property & Review
Quiz
•
6th Grade
20 questions
Writing Algebraic Expressions
Quiz
•
6th Grade
20 questions
Ratios/Rates and Unit Rates
Quiz
•
6th Grade
20 questions
Writing and Graphing Inequalities
Quiz
•
6th Grade
10 questions
Unit Rate
Quiz
•
6th Grade
20 questions
Graphing Inequalities on a Number Line
Quiz
•
6th - 9th Grade
18 questions
Combining Like Terms
Quiz
•
6th Grade