Correlation Coefficient and Linear Regression Review
Quiz
•
Mathematics
•
11th Grade
•
Practice Problem
•
Medium
Standards-aligned

Anthony Clark
Used 1+ times
FREE Resource
Enhance your content in a minute
15 questions
Show all answers
1.
MULTIPLE CHOICE QUESTION
1 min • 1 pt

r=.99
r=.98
r=20.7
r=-35
2.
MULTIPLE CHOICE QUESTION
1 min • 1 pt
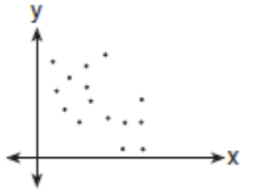
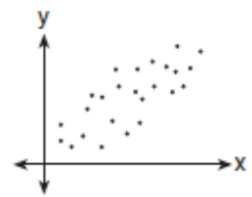
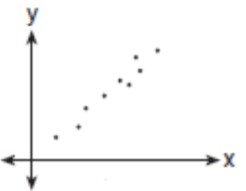
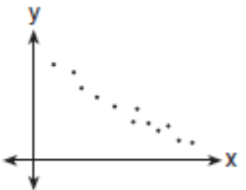
Which graph most clearly shows a positive correlation between the x- and y−values?


3.
MULTIPLE CHOICE QUESTION
1 min • 1 pt

Which correlation coefficient is most accurate for this data set?
r = - 0.3
r = 0.99
r = -0.99
4.
MULTIPLE CHOICE QUESTION
1 min • 1 pt

The linear regression equation that best represents the line of best fit for the data is y=20.8x-35. What does the slope represent?
The number of bacteria increase by 20.8 per hour
The number of bacteria increase by 20.8 per minute
The number of bacteria decrease by 35 per hour
The number of bacteria decrease by 35 per minute
Tags
CCSS.HSF.LE.B.5
5.
MULTIPLE CHOICE QUESTION
1 min • 1 pt

The linear regression equation that best represents the line of best fit for the data is y=20.8x-35. Use the equation to predict the number of bacteria in 24 hours.
35
277
464
819
6.
MULTIPLE CHOICE QUESTION
1 min • 1 pt
Which graph most clearly shows a negative correlation between the x- and y−values?


7.
MULTIPLE CHOICE QUESTION
1 min • 1 pt
Which graph most clearly shows a no correlation between the x- and y−values?


Access all questions and much more by creating a free account
Create resources
Host any resource
Get auto-graded reports

Continue with Google

Continue with Email

Continue with Classlink

Continue with Clever
or continue with

Microsoft
%20(1).png)
Apple
Others
Already have an account?
Similar Resources on Wayground

12 questions
Math Riddles (Panitia Matematik)
Quiz
•
9th - 11th Grade

20 questions
Math 10C Labelling Right Triangles
Quiz
•
8th - 11th Grade

10 questions
parallel lines and transversals
Quiz
•
9th - 11th Grade

10 questions
Quiz 4 on sets
Quiz
•
9th Grade - University

10 questions
CLASS-IX MATHS
Quiz
•
9th - 12th Grade

10 questions
Refuerzo Prueba Saber
Quiz
•
9th - 12th Grade

12 questions
Razonamiento Cuantitativo
Quiz
•
1st - 12th Grade

15 questions
Supplementary angles
Quiz
•
7th - 11th Grade
Popular Resources on Wayground

15 questions
Fractions on a Number Line
Quiz
•
3rd Grade

20 questions
Equivalent Fractions
Quiz
•
3rd Grade

25 questions
Multiplication Facts
Quiz
•
5th Grade

54 questions
Analyzing Line Graphs & Tables
Quiz
•
4th Grade

22 questions
fractions
Quiz
•
3rd Grade

20 questions
Main Idea and Details
Quiz
•
5th Grade

20 questions
Context Clues
Quiz
•
6th Grade

15 questions
Equivalent Fractions
Quiz
•
4th Grade
Discover more resources for Mathematics

12 questions
Add and Subtract Polynomials
Quiz
•
9th - 12th Grade

15 questions
Exponential Growth and Decay Word Problems Practice
Quiz
•
9th - 12th Grade

20 questions
Classifying Polynomials by Degree and Number of Terms
Quiz
•
11th Grade

17 questions
Explore Experimental and Theoretical Probability
Quiz
•
7th - 12th Grade

15 questions
Parallelogram Properties
Quiz
•
10th - 12th Grade

10 questions
Special Right Triangles
Quiz
•
11th Grade

18 questions
Solving Systems- Word Problems
Quiz
•
9th - 12th Grade

34 questions
7.4 Review Cubic and Cube Root Functions
Quiz
•
10th - 12th Grade


