
Function Behavior of Quadratics
10th Grade
•20 Qs

Similar activities
PS Matematika
10th Grade
•20 Qs
Liczba Pi
10th Grade
•15 Qs
SCIEMATICS QUIZ
10th - 11th Grade
•15 Qs
Performance Test #1 Circles and Conic Section
10th - 11th Grade
•15 Qs
MATEMATICAS. TRIMESTRE 1
1st - 10th Grade
•20 Qs
Sequences
10th Grade
•20 Qs
Baris dan Deret
7th - 12th Grade
•16 Qs
Trigonometriniai sąryšiai
10th Grade
•19 Qs

Function Behavior of Quadratics
Quiz
•
Mathematics
•
10th Grade
•
Practice Problem
•
Hard
+4
Standards-aligned

Anthony Clark
FREE Resource
Enhance your content in a minute
20 questions
Show all answers
1.
MULTIPLE CHOICE QUESTION
1 min • 1 pt
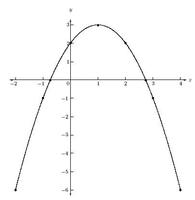
Describe the end behavior of the graph.
x →∞, y→⁻∞ and x →⁻∞,y→⁻∞
x →∞, y→∞ and x→⁻∞, y→∞
x →∞, y→∞ and x→⁻∞, y→0
x →∞,y→∞ and x→⁻∞, y→⁻∞
Tags
CCSS.HSF-IF.C.7A
2.
MULTIPLE CHOICE QUESTION
1 min • 1 pt

The end behavior of a polynomial function is determined by the degree and the sign of the leading coefficient.
Identify the degree of the polynomial and the sign of the leading coefficient
Leading Coefficient Positive
Degree - Even
Leading Coefficient Positive
Degree - Odd
Leading Coefficient Negative
Degree - Even
Leading Coefficient Negative
Degree - Odd
3.
MULTIPLE CHOICE QUESTION
1 min • 1 pt

Describe the end behavior of the graph.
x → ∞, y→ ∞ and
x→ ∞, y→⁻∞
x → ∞, y→ ∞ and
x→⁻∞, y→∞
None of these
x →∞,y→⁻∞ and
x→∞, y→⁻∞
Tags
CCSS.HSF-IF.C.7A
4.
MULTIPLE CHOICE QUESTION
1 min • 1 pt
What is the vertex for
f(x)=4(x-2)2 + 3
(-2, 3)
(2,-3)
(4,3)
(2,3)
5.
MULTIPLE CHOICE QUESTION
1 min • 1 pt

Two functions are shown below. Quadratic function, f(x), is represented in the graph below. Quadratic function, g(x), is represented in the table. Which function is increasing over the interval x > 1?
f(x)
g(x)
Answer explanation
g(x) increases where x > 1. f(x) increases where x > -1.
Tags
CCSS.8.F.A.2
CCSS.HSF.IF.C.9
6.
MULTIPLE CHOICE QUESTION
1 min • 1 pt
Which of the following represents a quadratic function?
7.
MULTIPLE CHOICE QUESTION
1 min • 1 pt
y = x2 - 4x + 5
down and down
down and up
up and down
up and up
Tags
CCSS.HSF-IF.C.7A
Access all questions and much more by creating a free account
Create resources
Host any resource
Get auto-graded reports
Continue with Google

Continue with Email
Continue with Classlink
Continue with Clever
or continue with
Microsoft
%20(1).png)
Apple
Others
Already have an account?
Similar Resources on Wayground
16 questions
Enters (Easy)
Quiz
•
7th - 12th Grade
20 questions
Математикалық сауаттылық
Quiz
•
1st Grade - Professio...
15 questions
multiplication quiz
Quiz
•
10th Grade
17 questions
Matrikulasi Final Test
Quiz
•
10th Grade
16 questions
PELUANG 8
Quiz
•
9th - 12th Grade
15 questions
Ulangkaji Nombor Perdana
Quiz
•
1st - 12th Grade
20 questions
Mineduc D
Quiz
•
7th - 12th Grade
15 questions
Quiz#4: Distance and Midpoint Formula
Quiz
•
10th Grade
Popular Resources on Wayground
15 questions
Fractions on a Number Line
Quiz
•
3rd Grade
20 questions
Equivalent Fractions
Quiz
•
3rd Grade
25 questions
Multiplication Facts
Quiz
•
5th Grade
22 questions
fractions
Quiz
•
3rd Grade
20 questions
Main Idea and Details
Quiz
•
5th Grade
20 questions
Context Clues
Quiz
•
6th Grade
15 questions
Equivalent Fractions
Quiz
•
4th Grade
20 questions
Figurative Language Review
Quiz
•
6th Grade
Discover more resources for Mathematics
25 questions
Complementary and Supplementary Angles
Quiz
•
7th - 10th Grade
12 questions
Add and Subtract Polynomials
Quiz
•
9th - 12th Grade
13 questions
Model Exponential Growth and Decay Scenarios
Quiz
•
9th - 12th Grade
27 questions
7.2.3 Quadrilateral Properties
Quiz
•
9th - 12th Grade
16 questions
Converting Improper Fractions to Mixed Numbers
Quiz
•
4th - 10th Grade
10 questions
Simplifying Expressions by Combining Like Terms
Interactive video
•
6th - 10th Grade
10 questions
Simplifying Expressions with the Distributive Property
Interactive video
•
6th - 10th Grade
10 questions
Key Features of Quadratic Functions
Interactive video
•
8th - 12th Grade