Science Unit # 3 Force & Motion Review
Authored by Rachel Galvan
Science
5th Grade
NGSS covered
Used 28+ times

AI Actions
Add similar questions
Adjust reading levels
Convert to real-world scenario
Translate activity
More...
Content View
Student View
8 questions
Show all answers
1.
MULTIPLE CHOICE QUESTION
3 mins • 1 pt

A student conducts the investigation shown in the diagram. In this experiment a paper cup hangs from a string tied to a single uncooked spaghetti noodle. The student measures and records the mass of a marble. The student then adds marbles to the paper cup one at a time. Which question is the student most likely trying to answer with this investigation?
A. How long should the string that holds the paper cup be in order to support the greatest mass of marbles?
B. How does the distance between the two chairs affect the amount of force it takes for the spaghetti noodle to break?
C How many spaghetti noodles will it take to hold up the mass of a marble?
D How many marbles will it take to break the spaghetti noodle?
Tags
NGSS.MS-PS2-2
2.
MULTIPLE CHOICE QUESTION
2 mins • 1 pt

The diagrams show two trials of an experiment in which a spring scale was used to measure force. This experiment can be used to determine —
F how the mass of a box of marbles affects the mass of a dictionary
G how force affects the mass of two objects
H how the force used to pull a dictionary affects the mass of a box of marbles
J how different masses can affect the force needed to move objects
Tags
NGSS.MS-PS2-2
3.
MULTIPLE CHOICE QUESTION
2 mins • 1 pt

A student designs an experiment to test the force of a spring using a spring launcher and four spheres with the same diameter but with different masses. What tool would help the student gather data for this experiment?
A. A triple beam balance to find the mass of each sphere before it is launched
B A meterstick to measure the height each sphere reaches after the sphere is launched
C A beaker to measure the volume of each sphere before the sphere is launched
D A funnel to place the spheres more easily into the spring launcher
Tags
NGSS.MS-PS2-2
NGSS.MS-PS2-1
4.
MULTIPLE CHOICE QUESTION
2 mins • 1 pt

A student designs an experiment to test the effect of the width of a piece of elastic on the elastic’s ability to stretch. The student chooses four pieces of elastic with different widths but the same length. The student then attaches blocks with different masses to the pieces of elastic. The results of the student’s experiment are shown below. What did the student do to make this an unfair experiment?
F Used more than four pieces of elastic and four blocks
G Used blocks with enough mass to cause the four pieces of elastic to break
H Used blocks of different masses on the four pieces of elastic
J Used four pieces of elastic with different lengths but the same width
5.
MULTIPLE CHOICE QUESTION
2 mins • 1 pt

Students design an experiment to determine how much force is needed to move blocks of wood of different masses slowly across a lab table. Which procedure should students include in their design?
A Conduct ten trials, pulling in a different direction each time
B Conduct ten trials, pulling each block of wood in the same manner for each trial
C Conduct ten trials, using a different surface on the table for each trial
D Conduct ten trials, using a different scale to pull each block of wood
Tags
NGSS.MS-PS2-2
6.
MULTIPLE CHOICE QUESTION
2 mins • 1 pt

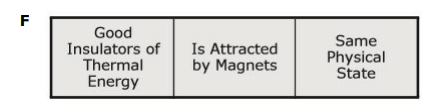
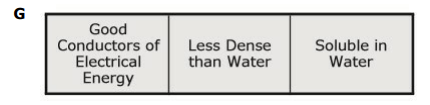
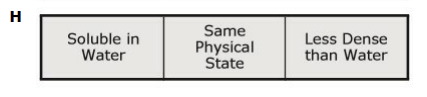
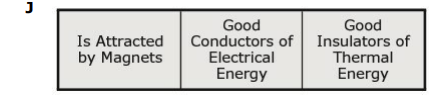
A student wants to classify four different objects based on physical properties. The student uses the questions shown in the table to test each object. Which statement incorrectly identifies two of the materials based on the classification of properties in the table?
F Material 3 is a piece of cardboard. Material 2 is a copper wire.
G Material 4 is an aluminum washer. Material 2 is a copper wire.
H Material 1 is a rubber ball. Material 4 is an aluminum washer.
J Material 1 is a copper wire. Material 4 is a rubber ball.
7.
MULTIPLE CHOICE QUESTION
2 mins • 1 pt

A worker built a sidewalk and pressed some large salt particles into the concrete while it was still wet. When the concrete was dry, the worker washed the side walk with water. The picture below shows the sidewalk after it was washed. What most likely happened to the water?
A It evaporated into a gas.
B It turned into concrete.
C It dissolved in the water.
D It turned into a solid.
Tags
NGSS.MS-PS1-2

Access all questions and much more by creating a free account
Create resources
Host any resource
Get auto-graded reports
Continue with Google

Continue with Email
Continue with Classlink
Continue with Clever
or continue with
Microsoft
%20(1).png)
Apple
Others
Already have an account?
