Speed Graph
Authored by Lisa Thompson
Science
6th Grade
NGSS covered

AI Actions
Add similar questions
Adjust reading levels
Convert to real-world scenario
Translate activity
More...
Content View
Student View
15 questions
Show all answers
1.
MULTIPLE CHOICE QUESTION
1 min • 1 pt

Segment A-B: The bus is moving at a _________________ of 10 m/s for 5 seconds.
accelerating
decelerating
constant speed
at rest
Tags
NGSS.MS-PS3-1
2.
MULTIPLE CHOICE QUESTION
1 min • 1 pt
Segment B-C: The bus is _________________. It is slowing down from 10 m/s rest in 3 seconds.
accelerating
decelerating
constant speed
at rest
3.
MULTIPLE CHOICE QUESTION
1 min • 1 pt
Segment C-D: The bus is _________________. It has stopped.
accelerating
decelerating
constant speed
at rest
Tags
NGSS.MS-PS3-1
NGSS.MS-PS3-5
4.
MULTIPLE CHOICE QUESTION
1 min • 1 pt
Segment D-E: The bus is _________________. It is gradually increasing it's speed.
accelerating
decelerating
constant speed
at rest
Tags
NGSS.MS-PS2-1
NGSS.MS-PS2-2
5.
MULTIPLE CHOICE QUESTION
1 min • 1 pt
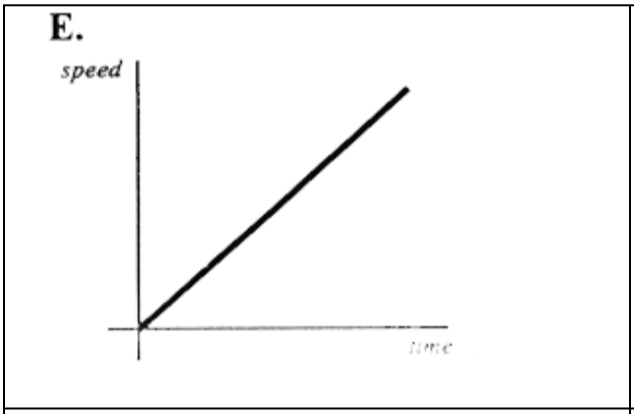
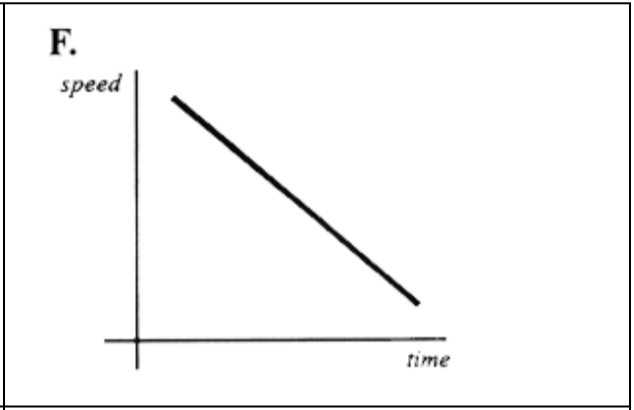
Match the graph to the description:
"The car is slowing down (negative acceleration)."
6.
MULTIPLE CHOICE QUESTION
1 min • 1 pt

At 60 seconds, how far had this object traveled?
0 m
10 m
20 m
40 m
Tags
NGSS.MS-PS3-1
7.
MULTIPLE CHOICE QUESTION
1 min • 1 pt

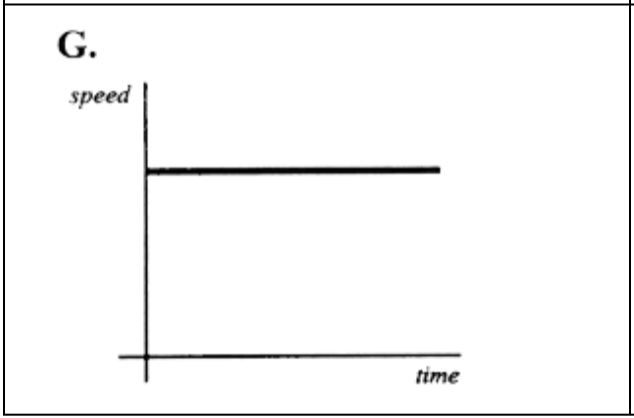
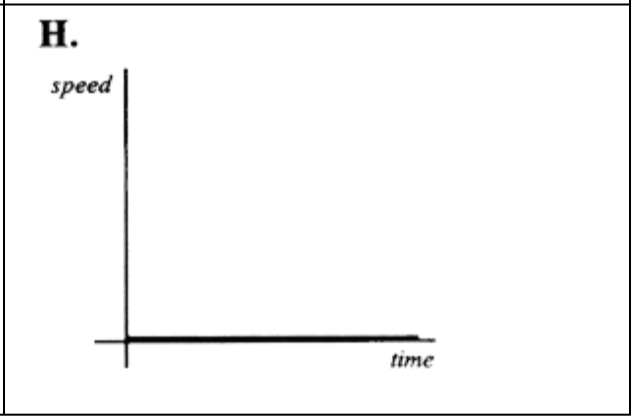
What does this graph represent?
Constant Speed
Acceleration
Not moving


Access all questions and much more by creating a free account
Create resources
Host any resource
Get auto-graded reports
Continue with Google

Continue with Email
Continue with Classlink
Continue with Clever
or continue with
Microsoft
%20(1).png)
Apple
Others
Already have an account?
Similar Resources on Wayground

10 questions
LiMiTiNg FaCtOrS
Quiz
•
6th Grade
10 questions
Substance and Mixtures
Quiz
•
6th Grade
10 questions
CPR
Quiz
•
1st - 7th Grade
20 questions
4. Ortografia-podsumowanie
Quiz
•
4th - 6th Grade
19 questions
Waves, Tides, & Currents Vocabulary Quiz
Quiz
•
6th Grade
12 questions
Forces
Quiz
•
6th - 8th Grade
10 questions
Changes of State
Quiz
•
6th Grade
15 questions
Bill Nye: Winds
Quiz
•
6th Grade
Popular Resources on Wayground
15 questions
Fractions on a Number Line
Quiz
•
3rd Grade
20 questions
Equivalent Fractions
Quiz
•
3rd Grade
25 questions
Multiplication Facts
Quiz
•
5th Grade
22 questions
fractions
Quiz
•
3rd Grade
20 questions
Main Idea and Details
Quiz
•
5th Grade
20 questions
Context Clues
Quiz
•
6th Grade
15 questions
Equivalent Fractions
Quiz
•
4th Grade
20 questions
Figurative Language Review
Quiz
•
6th Grade
Discover more resources for Science
33 questions
Grade 6 Quarter 3 PMA 5 Review
Quiz
•
6th - 8th Grade
20 questions
Rocks and The Rock Cycle
Quiz
•
6th Grade
12 questions
Newton's Laws of Motion
Lesson
•
6th - 8th Grade
10 questions
Exploring the Rock Cycle: Types and Formation
Interactive video
•
6th - 8th Grade
10 questions
Exploring the Layers of the Earth
Interactive video
•
6th - 10th Grade
20 questions
Cells! Cell Theory and Characteristics of Eukaryotes/Prokaryotes
Quiz
•
6th Grade
15 questions
Punnett Squares
Quiz
•
6th Grade
13 questions
Cell Theory
Quiz
•
6th Grade