Finding Averages
Authored by Lisa Thompson
Science
6th Grade
NGSS covered
Used 2+ times

AI Actions
Add similar questions
Adjust reading levels
Convert to real-world scenario
Translate activity
More...
Content View
Student View
25 questions
Show all answers
1.
MULTIPLE CHOICE QUESTION
1 min • 1 pt
a picture form of your data averages; use color on it, write the averages on top of each
data table
bar graph
Tags
NGSS.MS-PS3-1
2.
MULTIPLE CHOICE QUESTION
1 min • 1 pt
Total divided by number of trials you did; in a bar graph, you only show these, not every piece of data
trials
average
materials / equipment
procedure
Tags
NGSS.MS-PS3-1
3.
MULTIPLE CHOICE QUESTION
1 min • 1 pt

What is the average speed of the Worm's Journey?
2.25 meters/minute
2 meters/minute
1 meter/minute
Tags
NGSS.MS-PS3-1
4.
MULTIPLE CHOICE QUESTION
1 min • 1 pt

What was the average speed of the baseball for his third hit as it traveled in the air?
32 m/sec
20.7 m/sec
24 m/sec
27 m/sec
Tags
NGSS.MS-PS3-1
5.
MULTIPLE CHOICE QUESTION
1 min • 1 pt

Show all your work on your answer document.
400 m/min
0.0025 m/min
3600 mi/hr
40 m/s
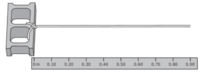
6.
MULTIPLE CHOICE QUESTION
1 min • 1 pt
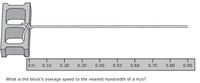
A block pulled 0.70 m to the right 0.14 s. What is the Average speed?
5
0.098
.74
1.4
7.
MULTIPLE CHOICE QUESTION
1 min • 1 pt

Usain Bolt of Jamaica holds the world record for the Men's 100 meter race. He finished in 9.58 seconds! What was his average speed? (Round to the nearest tenth.)
10.4 m/s
.1 m/s
1 m/s
10.5 m/s


Access all questions and much more by creating a free account
Create resources
Host any resource
Get auto-graded reports
Continue with Google

Continue with Email
Continue with Classlink
Continue with Clever
or continue with
Microsoft
%20(1).png)
Apple
Others
Already have an account?
