
Understanding Interquartile Range and Histograms
Authored by Brittany Cejer
Mathematics
6th Grade
CCSS covered


AI Actions
Add similar questions
Adjust reading levels
Convert to real-world scenario
Translate activity
More...
Content View
Student View
10 questions
Show all answers
1.
MULTIPLE CHOICE QUESTION
30 sec • 1 pt
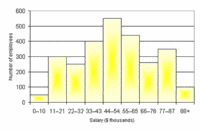
Which interval has 400 employees?
33-43
0-10
77-87
66-76
2.
MULTIPLE CHOICE QUESTION
30 sec • 1 pt
Given the data set: 3, 7, 8, 5, 12, 14, 21, 13, 18, 9. What is the interquartile range (IQR)?
5
8
10
12
3.
MULTIPLE CHOICE QUESTION
30 sec • 1 pt
Which of the following is the first quartile (Q1) of the data set: 4, 8, 15, 16, 23, 42?
8
15
16
23
4.
MULTIPLE CHOICE QUESTION
30 sec • 1 pt
If a histogram shows a peak (tallest column) at the interval 10-15, what does this indicate about the data?
Most data points are below 10.
Most data points are between 10 and 15.
Most data points are above 15.
The data is evenly distributed.
5.
MULTIPLE CHOICE QUESTION
30 sec • 1 pt
What is the third quartile (Q3) of the data set: 2, 4, 6, 8, 10, 12, 14, 16?
8
10
12
14
6.
DRAG AND DROP QUESTION
30 sec • 1 pt

The box plot shows the number of homework problems Beth had daily in math the last six weeks. What is the interquartile range of the data shown in the box plot?
(a)
Answer explanation
The interquartile range of the data shown in the box plot is 5, as it is the difference between the upper quartile (18) and the lower quartile (13).
Tags
6.12C
7.
MATH RESPONSE QUESTION
30 sec • 1 pt
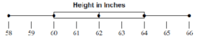
What is the interquartile range?
Mathematical Equivalence
ON

Access all questions and much more by creating a free account
Create resources
Host any resource
Get auto-graded reports

Continue with Google

Continue with Email

Continue with Microsoft
or continue with

%20(1).png)
Apple

Others
By signing up, you agree to our Terms of Service & Privacy Policy
Already have an account?

