- Resource Library
- Math
- Probability And Statistics
- Measures Of Center
- Data Distribution And Measures Of Center
Data Distribution and Measures of Center
Interactive Video
•
Mathematics
•
6th - 7th Grade
•
Practice Problem
•
Hard

Thomas White
FREE Resource
Read more
10 questions
Show all answers
1.
MULTIPLE CHOICE QUESTION
30 sec • 1 pt
What page should you open in your Go Math book for the guided practice?
Page 335
Page 340
Page 338
Page 342
2.
MULTIPLE CHOICE QUESTION
30 sec • 1 pt
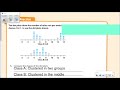
How is Class A's data distributed in the dot plot?
Clustered in two groups
Clustered in the middle
Evenly spread out
Clustered to the right
3.
MULTIPLE CHOICE QUESTION
30 sec • 1 pt
Where is Class B's data primarily clustered in the dot plot?
Towards the middle
In two groups
Evenly spread out
To the right
4.
MULTIPLE CHOICE QUESTION
30 sec • 1 pt
What are the peaks of Class A's dot plot?
5 and 12
3 and 9
6 and 14
4 and 13
5.
MULTIPLE CHOICE QUESTION
30 sec • 1 pt
What is the center of Class B's dot plot?
7
13
4
9
6.
MULTIPLE CHOICE QUESTION
30 sec • 1 pt
What is the range of Class A's data?
6
8
10
12
7.
MULTIPLE CHOICE QUESTION
30 sec • 1 pt
What is the range of Class B's data?
10
8
6
4
Access all questions and much more by creating a free account
Create resources
Host any resource
Get auto-graded reports
Continue with Google

Continue with Email
Continue with Classlink
Continue with Clever
or continue with
Microsoft
%20(1).png)
Apple
Others
Already have an account?
