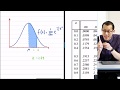
Understanding Normal Distribution Concepts
Interactive Video
•
Mathematics
•
9th - 10th Grade
•
Practice Problem
•
Hard

Lucas Foster
FREE Resource
Read more
10 questions
Show all answers
1.
MULTIPLE CHOICE QUESTION
30 sec • 1 pt
What is the shape of the normal distribution curve commonly referred to as?
A straight line
A bell curve
A zigzag pattern
A square
2.
MULTIPLE CHOICE QUESTION
30 sec • 1 pt
Why is the normal distribution considered a useful model?
It is a new concept in statistics.
It only applies to temperature measurements.
It represents the probability density function of many independent processes.
It is easy to calculate without any tools.
3.
MULTIPLE CHOICE QUESTION
30 sec • 1 pt
Which of the following is NOT a method mentioned for solving normal distribution integrals?
Trapezoidal rule
Technology
Graphical estimation
Statistical tables
4.
MULTIPLE CHOICE QUESTION
30 sec • 1 pt
What is the purpose of statistical tables in the context of normal distribution?
To provide exact values for all possible z-scores
To approximate areas under the normal distribution curve
To replace the need for understanding probability
To simplify the calculation of mean and median
5.
MULTIPLE CHOICE QUESTION
30 sec • 1 pt
How can you increase the accuracy of a z-score using a statistical table?
By using a calculator
By adding more decimal places
By using a different table
By guessing the value
6.
MULTIPLE CHOICE QUESTION
30 sec • 1 pt
What does a z-score of 1.64 represent in a statistical table?
The probability of a negative outcome
The mean of the distribution
The area under the curve from zero to 1.64
The total area under the curve
7.
MULTIPLE CHOICE QUESTION
30 sec • 1 pt
In a normal distribution, what is the maximum area you can get from the middle to one side?
0.25
0.5
0.75
1.0
Access all questions and much more by creating a free account
Create resources
Host any resource
Get auto-graded reports
Continue with Google

Continue with Email
Continue with Classlink
Continue with Clever
or continue with
Microsoft
%20(1).png)
Apple
Others
Already have an account?
Similar Resources on Wayground

6 questions
Understanding Generalized Cylinders in 3D Space
Interactive video
•
9th - 10th Grade
11 questions
Understanding Linear First Order Equations and Integrating Factors
Interactive video
•
9th - 10th Grade
11 questions
Physics Quiz on Inclined Plane and Newton's Second Law
Interactive video
•
9th - 10th Grade
11 questions
Newton's Second Law and Acceleration Quiz
Interactive video
•
9th - 10th Grade
11 questions
Investment Portfolio Spreadsheet Quiz
Interactive video
•
9th - 10th Grade
11 questions
Copywriting and Storytelling Quiz
Interactive video
•
9th - 10th Grade
11 questions
Mechanical Energy Conservation Quiz
Interactive video
•
9th - 10th Grade
11 questions
COVID-19 Vaccine Development Quiz
Interactive video
•
9th - 10th Grade
Popular Resources on Wayground
15 questions
Fractions on a Number Line
Quiz
•
3rd Grade
20 questions
Equivalent Fractions
Quiz
•
3rd Grade
25 questions
Multiplication Facts
Quiz
•
5th Grade
54 questions
Analyzing Line Graphs & Tables
Quiz
•
4th Grade
22 questions
fractions
Quiz
•
3rd Grade
20 questions
Main Idea and Details
Quiz
•
5th Grade
20 questions
Context Clues
Quiz
•
6th Grade
15 questions
Equivalent Fractions
Quiz
•
4th Grade
Discover more resources for Mathematics
20 questions
Graphing Inequalities on a Number Line
Quiz
•
6th - 9th Grade
18 questions
SAT Prep: Ratios, Proportions, & Percents
Quiz
•
9th - 10th Grade
12 questions
Exponential Growth and Decay
Quiz
•
9th Grade
12 questions
Parallel Lines Cut by a Transversal
Quiz
•
10th Grade
12 questions
Add and Subtract Polynomials
Quiz
•
9th - 12th Grade
15 questions
Combine Like Terms and Distributive Property
Quiz
•
8th - 9th Grade
20 questions
Function or Not a Function
Quiz
•
8th - 9th Grade
10 questions
Elijah McCoy: Innovations and Impact in Black History
Interactive video
•
6th - 10th Grade