Understanding Slope and Intercepts
Interactive Video
•
Mathematics
•
9th - 10th Grade
•
Practice Problem
•
Hard

Olivia Brooks
FREE Resource
Read more
6 questions
Show all answers
1.
MULTIPLE CHOICE QUESTION
30 sec • 1 pt
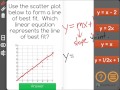
What is the primary purpose of a line of best fit in a scatter plot?
To connect all data points
To pass through the origin
To represent the average trend of the data
To highlight the highest data point
2.
MULTIPLE CHOICE QUESTION
30 sec • 1 pt
In the equation y = mx + b, what does 'b' represent?
The slope of the line
The x-intercept
The y-intercept
The average of x values
3.
MULTIPLE CHOICE QUESTION
30 sec • 1 pt
If a line has a y-intercept of zero, how would the equation y = mx + b be simplified?
y = mx
y = x + b
y = b
y = mx + 1
4.
MULTIPLE CHOICE QUESTION
30 sec • 1 pt
How is the slope of a line determined in a scatter plot?
By measuring the distance between the first and last points
By calculating the rise over run
By finding the midpoint of the data
By counting the number of data points
5.
MULTIPLE CHOICE QUESTION
30 sec • 1 pt
What is the slope of a line if the rise is 1 and the run is also 1?
2
Undefined
1
0
6.
MULTIPLE CHOICE QUESTION
30 sec • 1 pt
What is the simplified form of the equation y = 1x + 0?
y = 1x
y = x
y = 1
y = 0
Access all questions and much more by creating a free account
Create resources
Host any resource
Get auto-graded reports
Continue with Google

Continue with Email
Continue with Classlink
Continue with Clever
or continue with
Microsoft
%20(1).png)
Apple
Others
Already have an account?
Similar Resources on Wayground
Popular Resources on Wayground

15 questions
Fractions on a Number Line
Quiz
•
3rd Grade
20 questions
Equivalent Fractions
Quiz
•
3rd Grade
25 questions
Multiplication Facts
Quiz
•
5th Grade
29 questions
Alg. 1 Section 5.1 Coordinate Plane
Quiz
•
9th Grade
22 questions
fractions
Quiz
•
3rd Grade
11 questions
FOREST Effective communication
Lesson
•
KG
20 questions
Main Idea and Details
Quiz
•
5th Grade
20 questions
Context Clues
Quiz
•
6th Grade
Discover more resources for Mathematics
29 questions
Alg. 1 Section 5.1 Coordinate Plane
Quiz
•
9th Grade
20 questions
Graphing Inequalities on a Number Line
Quiz
•
6th - 9th Grade
20 questions
Box and Whisker Plots
Quiz
•
9th Grade
18 questions
Exponential Growth and Decay
Quiz
•
9th Grade
20 questions
Function or Not a Function
Quiz
•
8th - 9th Grade
20 questions
SSS/SAS
Quiz
•
9th - 12th Grade
14 questions
Making Inferences From Samples
Quiz
•
7th - 12th Grade
23 questions
CCG - CH8 Polygon angles and area Review
Quiz
•
9th - 12th Grade