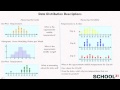
Understanding Graphical Data Representation
Interactive Video
•
Mathematics
•
6th - 8th Grade
•
Practice Problem
•
Hard

Thomas White
FREE Resource
Read more
8 questions
Show all answers
1.
MULTIPLE CHOICE QUESTION
30 sec • 1 pt
What is one of the main benefits of using graphical data representation?
It makes data look more colorful.
It helps in understanding data distribution.
It reduces the amount of data.
It eliminates the need for data analysis.
2.
MULTIPLE CHOICE QUESTION
30 sec • 1 pt
In a dot plot, what does each dot represent?
The average temperature of the week.
A range of temperatures.
A single temperature on a specific day.
The highest temperature recorded.
3.
MULTIPLE CHOICE QUESTION
30 sec • 1 pt
How can you identify the middle temperature in a dot plot?
By looking at the most frequently occurring temperature.
By calculating the average of all temperatures.
By visually estimating the center of the data points.
By identifying the highest and lowest temperatures.
4.
MULTIPLE CHOICE QUESTION
30 sec • 1 pt
What is a histogram used for?
To calculate the average temperature.
To highlight the highest temperature.
To show data in ranges.
To display individual data points.
5.
MULTIPLE CHOICE QUESTION
30 sec • 1 pt
How does a histogram differ from a dot plot?
A histogram is more colorful than a dot plot.
A histogram is used for temperature data, while a dot plot is not.
A histogram shows data in ranges, while a dot plot shows individual data points.
A histogram is always more accurate than a dot plot.
6.
MULTIPLE CHOICE QUESTION
30 sec • 1 pt
What is an outlier in a data set?
A data point that is far from the rest of the data.
A data point that is the lowest in the set.
A data point that is the average of all others.
A data point that is the highest in the set.
7.
MULTIPLE CHOICE QUESTION
30 sec • 1 pt
Why is City C's temperature considered hardest to predict?
Because it has the lowest temperatures.
Because it has the highest temperatures.
Because its temperatures vary widely.
Because it has a consistent temperature range.
Access all questions and much more by creating a free account
Create resources
Host any resource
Get auto-graded reports
Continue with Google

Continue with Email
Continue with Classlink
Continue with Clever
or continue with
Microsoft
%20(1).png)
Apple
Others
Already have an account?
Similar Resources on Wayground
Popular Resources on Wayground

15 questions
Fractions on a Number Line
Quiz
•
3rd Grade
20 questions
Equivalent Fractions
Quiz
•
3rd Grade
25 questions
Multiplication Facts
Quiz
•
5th Grade
22 questions
fractions
Quiz
•
3rd Grade
20 questions
Main Idea and Details
Quiz
•
5th Grade
20 questions
Context Clues
Quiz
•
6th Grade
15 questions
Equivalent Fractions
Quiz
•
4th Grade
20 questions
Figurative Language Review
Quiz
•
6th Grade
Discover more resources for Mathematics
20 questions
Exponents
Quiz
•
6th Grade
22 questions
distributive property
Quiz
•
7th Grade
15 questions
Distributive Property & Review
Quiz
•
6th Grade
20 questions
Writing Algebraic Expressions
Quiz
•
6th Grade
20 questions
Ratios/Rates and Unit Rates
Quiz
•
6th Grade
20 questions
Writing and Graphing Inequalities
Quiz
•
6th Grade
15 questions
Product of Powers Property A1 U7
Quiz
•
8th Grade
20 questions
Laws of Exponents
Quiz
•
8th Grade