
- Resource Library
- Math
- Percents, Ratios, And Rates
- Constant Of Proportionality
- Cycle 3 Proportional Relationships
Cycle 3 Proportional Relationships
Authored by Eden Westergaard
Mathematics
6th Grade
CCSS covered
Used 2+ times


AI Actions
Add similar questions
Adjust reading levels
Convert to real-world scenario
Translate activity
More...
Content View
Student View
20 questions
Show all answers
1.
MULTIPLE CHOICE QUESTION
30 sec • 1 pt
Maria reads an average of 1.5 books each week. Let x be the number of weeks and y be the number of books. Which equation represents this proportional relationship?
52 = 1.5x
x = 1.5y
y = 1.5x
y = 52x
Tags
CCSS.7.RP.A.2C
2.
LABELING QUESTION
1 min • 1 pt
Jorge hikes at a constant speed of 2 miles per hour. Complete the missing entries so the table represents a proportional relationship with this rate.
Tags
CCSS.7.RP.A.2B
3.
MULTIPLE CHOICE QUESTION
45 sec • 1 pt

Does this graph show a proportional relationship between the pounds of apples bought and the price?
Yes, because the line on the graph is straight.
Yes, because the line moves through the y-axis.
No, because the line does not pass through the origin.
No, because the line does not give a y-value for every x-value.
Tags
CCSS.7.RP.A.2D
4.
FILL IN THE BLANKS QUESTION
1 min • 1 pt
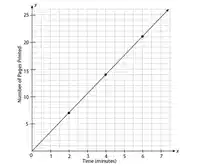
Sam is using a laser printer to print a report. The line on the graph shows the relationship between x, the number of
minutes the machine spends printing, and y, the number of pages that are printed. What is the constant of proportionality for the line representing this relationship?
(a)
Tags
CCSS.7.RP.A.2B
5.
MULTIPLE CHOICE QUESTION
1 min • 1 pt
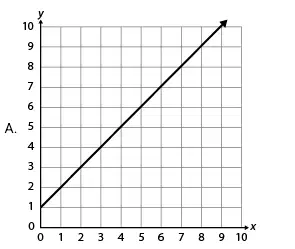
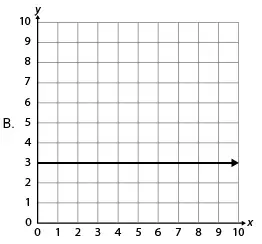
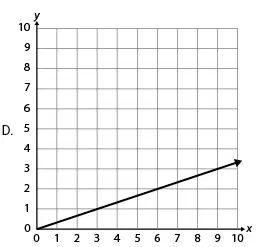
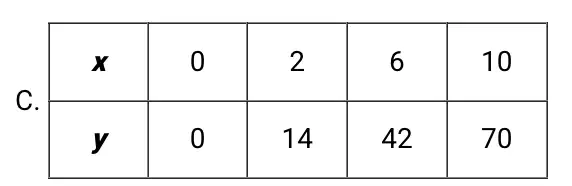
Which graph represents a proportional relationship between x and y?

Tags
CCSS.7.RP.A.2D
6.
MULTIPLE CHOICE QUESTION
1 min • 1 pt
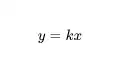
For the equation y = kx, which expression is equal to the constant of proportionality k?
Tags
CCSS.7.RP.A.2B
7.
MULTIPLE SELECT QUESTION
1 min • 1 pt
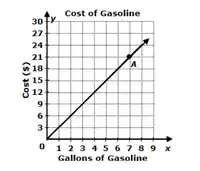
The graph titled "Cost of Gasoline" shows a line passing through the origin and the point labeled A at (9, 27). The x-axis is Gallons of Gasoline and the y-axis is Cost ($). Select ALL statements that are correct.
A. The cost of one gallon of gas is $3.
B. Point A on the graph represents the cost of 21 gallons of gas.
C. Point (0, 0) on the graph means no gallons of gas were purchased.
D. The cost of gas increases by $1 for each gallon purchased.
E. If 9 gallons of gas were purchased, the total cost would be $27.
Tags
CCSS.7.RP.A.2D




Access all questions and much more by creating a free account
Create resources
Host any resource
Get auto-graded reports

Continue with Google

Continue with Email

Continue with Microsoft
or continue with

%20(1).png)
Apple

Others
By signing up, you agree to our Terms of Service & Privacy Policy
Already have an account?

