
Business Mathematics - Final Examinations
Authored by Bing Dimatulac
Mathematics
11th Grade
Used 1+ times


AI Actions
Add similar questions
Adjust reading levels
Convert to real-world scenario
Translate activity
More...
Content View
Student View
50 questions
Show all answers
1.
MULTIPLE CHOICE QUESTION
30 sec • 1 pt
Data presentation refers to the organization of data into tables, graphs, and charts, so that logical and statistical conclusions can be derived from the collected measurements.
True
False
2.
MULTIPLE CHOICE QUESTION
30 sec • 1 pt
Textual presentation is a type of presentation that uses a pie graph.
True
False
3.
MULTIPLE CHOICE QUESTION
30 sec • 1 pt
One of the most widely used forms of presentation of data is the tabular presentation.
True
False
4.
MULTIPLE CHOICE QUESTION
30 sec • 1 pt
TRUE OR FALSE: The graphical presentation of data provides a visualization of the presented data. This is the least precise form of data presentation.
True
False
5.
MULTIPLE CHOICE QUESTION
30 sec • 1 pt
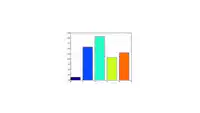
TRUE OR FALSE: This is a line graph.
True
False
6.
MULTIPLE CHOICE QUESTION
30 sec • 1 pt
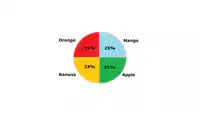
This is an example of a pie graph.
True
False
7.
MULTIPLE CHOICE QUESTION
30 sec • 1 pt
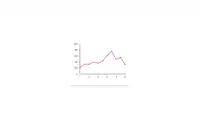
This is a line graph.
True
False
Access all questions and much more by creating a free account
Create resources
Host any resource
Get auto-graded reports

Continue with Google

Continue with Email

Continue with Microsoft
or continue with

%20(1).png)
Apple

Others
Already have an account?



