Understanding Line Plots with Fractions
Interactive Video
•
Mathematics
•
1st - 5th Grade
•
Medium

Kia Gill
Used 1+ times
FREE Resource
8 questions
Show all answers
1.
MULTIPLE CHOICE QUESTION
30 sec • 1 pt
What was the purpose of the video tutorial?
To teach baking techniques
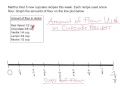
To create a line plot with fractions for cupcake recipes
To learn about different types of cupcakes
To compare different cupcake flavors
2.
MULTIPLE CHOICE QUESTION
30 sec • 1 pt
Why is it important to organize data on a line plot?
To make it difficult to read
To help answer questions about the data
To ensure it is confusing
To make it look attractive
3.
MULTIPLE CHOICE QUESTION
30 sec • 1 pt
What does the scale on a line plot help with?
Deciding the number of recipes
Placing data marks accurately
Determining the type of cupcakes
Choosing the best flour
4.
MULTIPLE CHOICE QUESTION
30 sec • 1 pt
What is the smallest fraction of flour used in the recipes?
1/4 cup
3/4 cup
3/8 cup
1/2 cup
5.
MULTIPLE CHOICE QUESTION
30 sec • 1 pt
What fraction represents the largest amount of flour used?
3/4 cup
1/2 cup
3/8 cup
1/4 cup
6.
MULTIPLE CHOICE QUESTION
30 sec • 1 pt
How many times was 1/2 cup of flour used according to the plot?
Twice
Once
Four times
Three times
7.
MULTIPLE CHOICE QUESTION
30 sec • 1 pt
What does each 'X' on the line plot represent?
A type of cupcake
A cup of sugar
A data point for the amount of flour
A mistake in plotting
Access all questions and much more by creating a free account
Create resources
Host any resource
Get auto-graded reports
Continue with Google

Continue with Email
Continue with Classlink
Continue with Clever
or continue with
Microsoft
%20(1).png)
Apple
Others
Already have an account?
