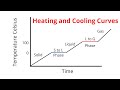
Exploring Heating and Cooling Curves
Interactive Video
•
Science
•
6th - 10th Grade
•
Practice Problem
•
Medium
Standards-aligned

Emma Peterson
Used 25+ times
FREE Resource
Standards-aligned
10 questions
Show all answers
1.
MULTIPLE CHOICE QUESTION
30 sec • 1 pt
What is represented on the y-axis of the heating and cooling graph?
Pressure in Pascals
Time in seconds
Temperature in Celsius
Volume in liters
Tags
NGSS.MS-PS1-4
NGSS.MS-PS3-4
2.
MULTIPLE CHOICE QUESTION
30 sec • 1 pt
At what temperature does water begin to melt?
100 degrees Celsius
50 degrees Celsius
25 degrees Celsius
0 degrees Celsius
Tags
NGSS.MS-PS1-4
3.
MULTIPLE CHOICE QUESTION
30 sec • 1 pt
What happens to the temperature during the phase change from solid to liquid?
It fluctuates
It remains constant
It decreases
It increases rapidly
Tags
NGSS.MS-PS1-4
4.
MULTIPLE CHOICE QUESTION
30 sec • 1 pt
What is the phase change called when a liquid turns into a gas?
Freezing
Condensation
Boiling
Sublimation
Tags
NGSS.MS-PS1-4
5.
MULTIPLE CHOICE QUESTION
30 sec • 1 pt
How can you determine the boiling point of a substance on the graph?
By checking the horizontal line on the y-axis
By observing the slope of the line
By measuring the area under the curve
By looking at the x-axis
6.
MULTIPLE CHOICE QUESTION
30 sec • 1 pt
What happens to kinetic energy during the phase change from solid to liquid?
It fluctuates
It remains constant
It decreases
It increases
Tags
NGSS.MS-PS1-4
NGSS.MS-PS3-4
7.
MULTIPLE CHOICE QUESTION
30 sec • 1 pt
During heating, what happens to potential energy when the temperature is rising?
It decreases
It fluctuates
It remains constant
It increases
Tags
NGSS.MS-PS1-4
NGSS.MS-PS3-4
Access all questions and much more by creating a free account
Create resources
Host any resource
Get auto-graded reports
Continue with Google

Continue with Email
Continue with Microsoft
or continue with

%20(1).png)
Apple
Others
Already have an account?
