Solving Absolute Value Equations and Inequalities by Graphing
Interactive Video
•
Mathematics
•
8th - 12th Grade
•
Practice Problem
•
Medium
+2
Standards-aligned

Lucas Foster
Used 1+ times
FREE Resource
Standards-aligned
Read more
10 questions
Show all answers
1.
MULTIPLE CHOICE QUESTION
30 sec • 1 pt
What is the main topic of the final video in the chapter?
Solving linear equations
Solving exponential equations
Solving quadratic equations
Solving absolute value equations and inequalities
2.
MULTIPLE CHOICE QUESTION
30 sec • 1 pt
When solving absolute value equations by graphing, what is the significance of the intersections?
They represent the average values
They represent the solutions to the equation
They represent the minimum values
They represent the maximum values
3.
MULTIPLE CHOICE QUESTION
30 sec • 1 pt
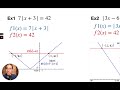
In the example given, what are the x-values that produce a y-value of 42?
9 and -3
0 and 42
3 and 9
3 and -9
4.
MULTIPLE CHOICE QUESTION
30 sec • 1 pt
What is the first step in solving an absolute value inequality by graphing?
Identifying the intervals where one function is less than the other
Finding the minimum value
Calculating the average value
Finding the maximum value
5.
MULTIPLE CHOICE QUESTION
30 sec • 1 pt
In the inequality example, what is the interval of x-values that make the function less than 42?
From -9 to 3, excluding -9 and 3
From -12 to 16, excluding -12 and 16
From -9 to 3, including -9 and 3
From -12 to 16, including -12 and 16
6.
MULTIPLE CHOICE QUESTION
30 sec • 1 pt
How can the interval of x-values be expressed?
As a maximum value
As interval notation or inequality notation
As a range of y-values
As a single point
Tags
CCSS.8.F.A.1
CCSS.HSF.IF.B.5
7.
MULTIPLE CHOICE QUESTION
30 sec • 1 pt
In the final example, what is the x-value that makes the blue function equal to zero?
-1.5
1.5
3
0
Access all questions and much more by creating a free account
Create resources
Host any resource
Get auto-graded reports
Continue with Google

Continue with Email
Continue with Classlink
Continue with Clever
or continue with
Microsoft
%20(1).png)
Apple
Others
Already have an account?
Popular Resources on Wayground

15 questions
Fractions on a Number Line
Quiz
•
3rd Grade
20 questions
Equivalent Fractions
Quiz
•
3rd Grade
25 questions
Multiplication Facts
Quiz
•
5th Grade
29 questions
Alg. 1 Section 5.1 Coordinate Plane
Quiz
•
9th Grade
22 questions
fractions
Quiz
•
3rd Grade
11 questions
FOREST Effective communication
Lesson
•
KG
20 questions
Main Idea and Details
Quiz
•
5th Grade
20 questions
Context Clues
Quiz
•
6th Grade
Discover more resources for Mathematics
29 questions
Alg. 1 Section 5.1 Coordinate Plane
Quiz
•
9th Grade
14 questions
finding slope from a graph
Quiz
•
8th Grade
20 questions
Graphing Inequalities on a Number Line
Quiz
•
6th - 9th Grade
8 questions
8th U6L1: Organizing Data
Quiz
•
8th Grade
20 questions
Slope from a Graph
Quiz
•
8th Grade
12 questions
8th U5 Test Review: Functions & Volume
Quiz
•
8th Grade
20 questions
Slope Intercept Form
Quiz
•
7th - 8th Grade
20 questions
Box and Whisker Plots
Quiz
•
9th Grade